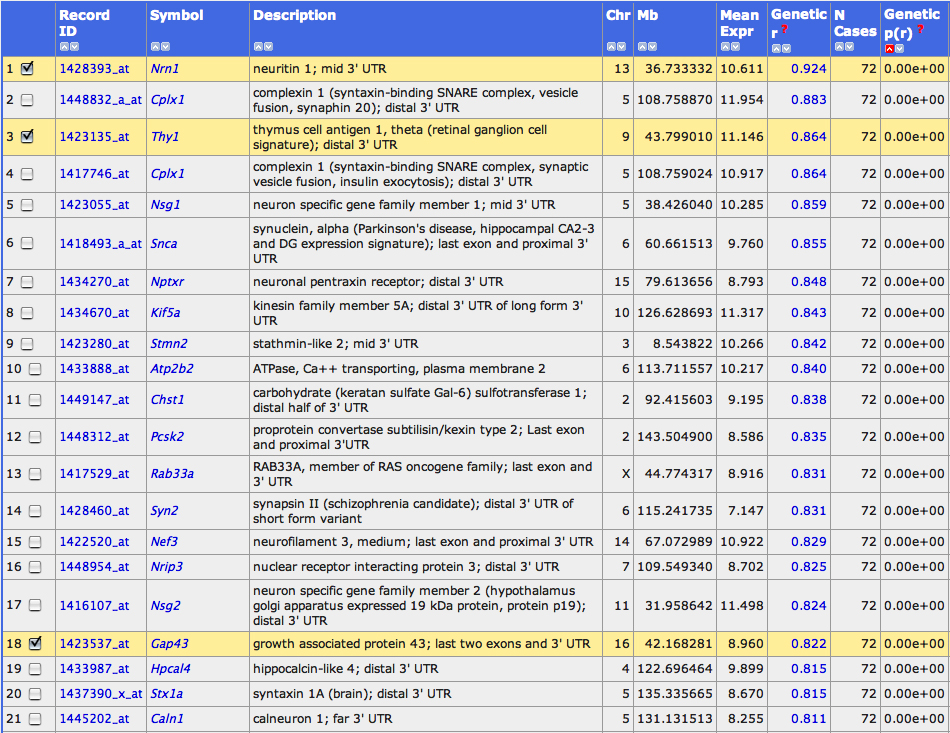
Figure 8. A list of genes associated with
retinal ganglion cells. Rows 1, 3, and 18 list three ganglion cell
signature genes used as bait with which to trap new candidate genes.
How to generate a synthetic trait
from three or more transcripts: Step 1. Select a set of
transcripts or other traits (even classic phenotype will work) and add
them to the Trait Collection as described in the legend to
Figure 6,
steps 1 and 2. For example, add the transcripts for
Thy1,
Nrn1,
and
Gap43 (probe sets 1423135_at, 1428393_at, 1423537_at). Step
2. Select the check boxes of the probe sets in the Trait Collection
window and then click the '
Correlation Matrix' button. A new
window will open. Scroll down to the section labeled PCA Traits. One or
more synthetic traits will be listed here. PC01 is the synthetic trait
that shares the most in common with the set of traits that you
submitted for analysis. Step 3. Click on the blue text of PCA Trait
PC01. This will open a Trait Data and Analysis page that can now be
used for various functions, including mapping and correlation analysis.
Step 4: To find other transcripts that share features with the PC01
trait constructed using
Thy1,
Nrn1, and
Gap43,
scroll to the '
Traits Correlations' section of the Trait Data
and Analysis page. Before clicking the Trait Correlation button change
the Choose Database pull-down menu to read Eye
M430v2 (Sep08)
RMA data.
 Figure 8 of Geisert, Mol Vis 2009; 15:1730-1763.