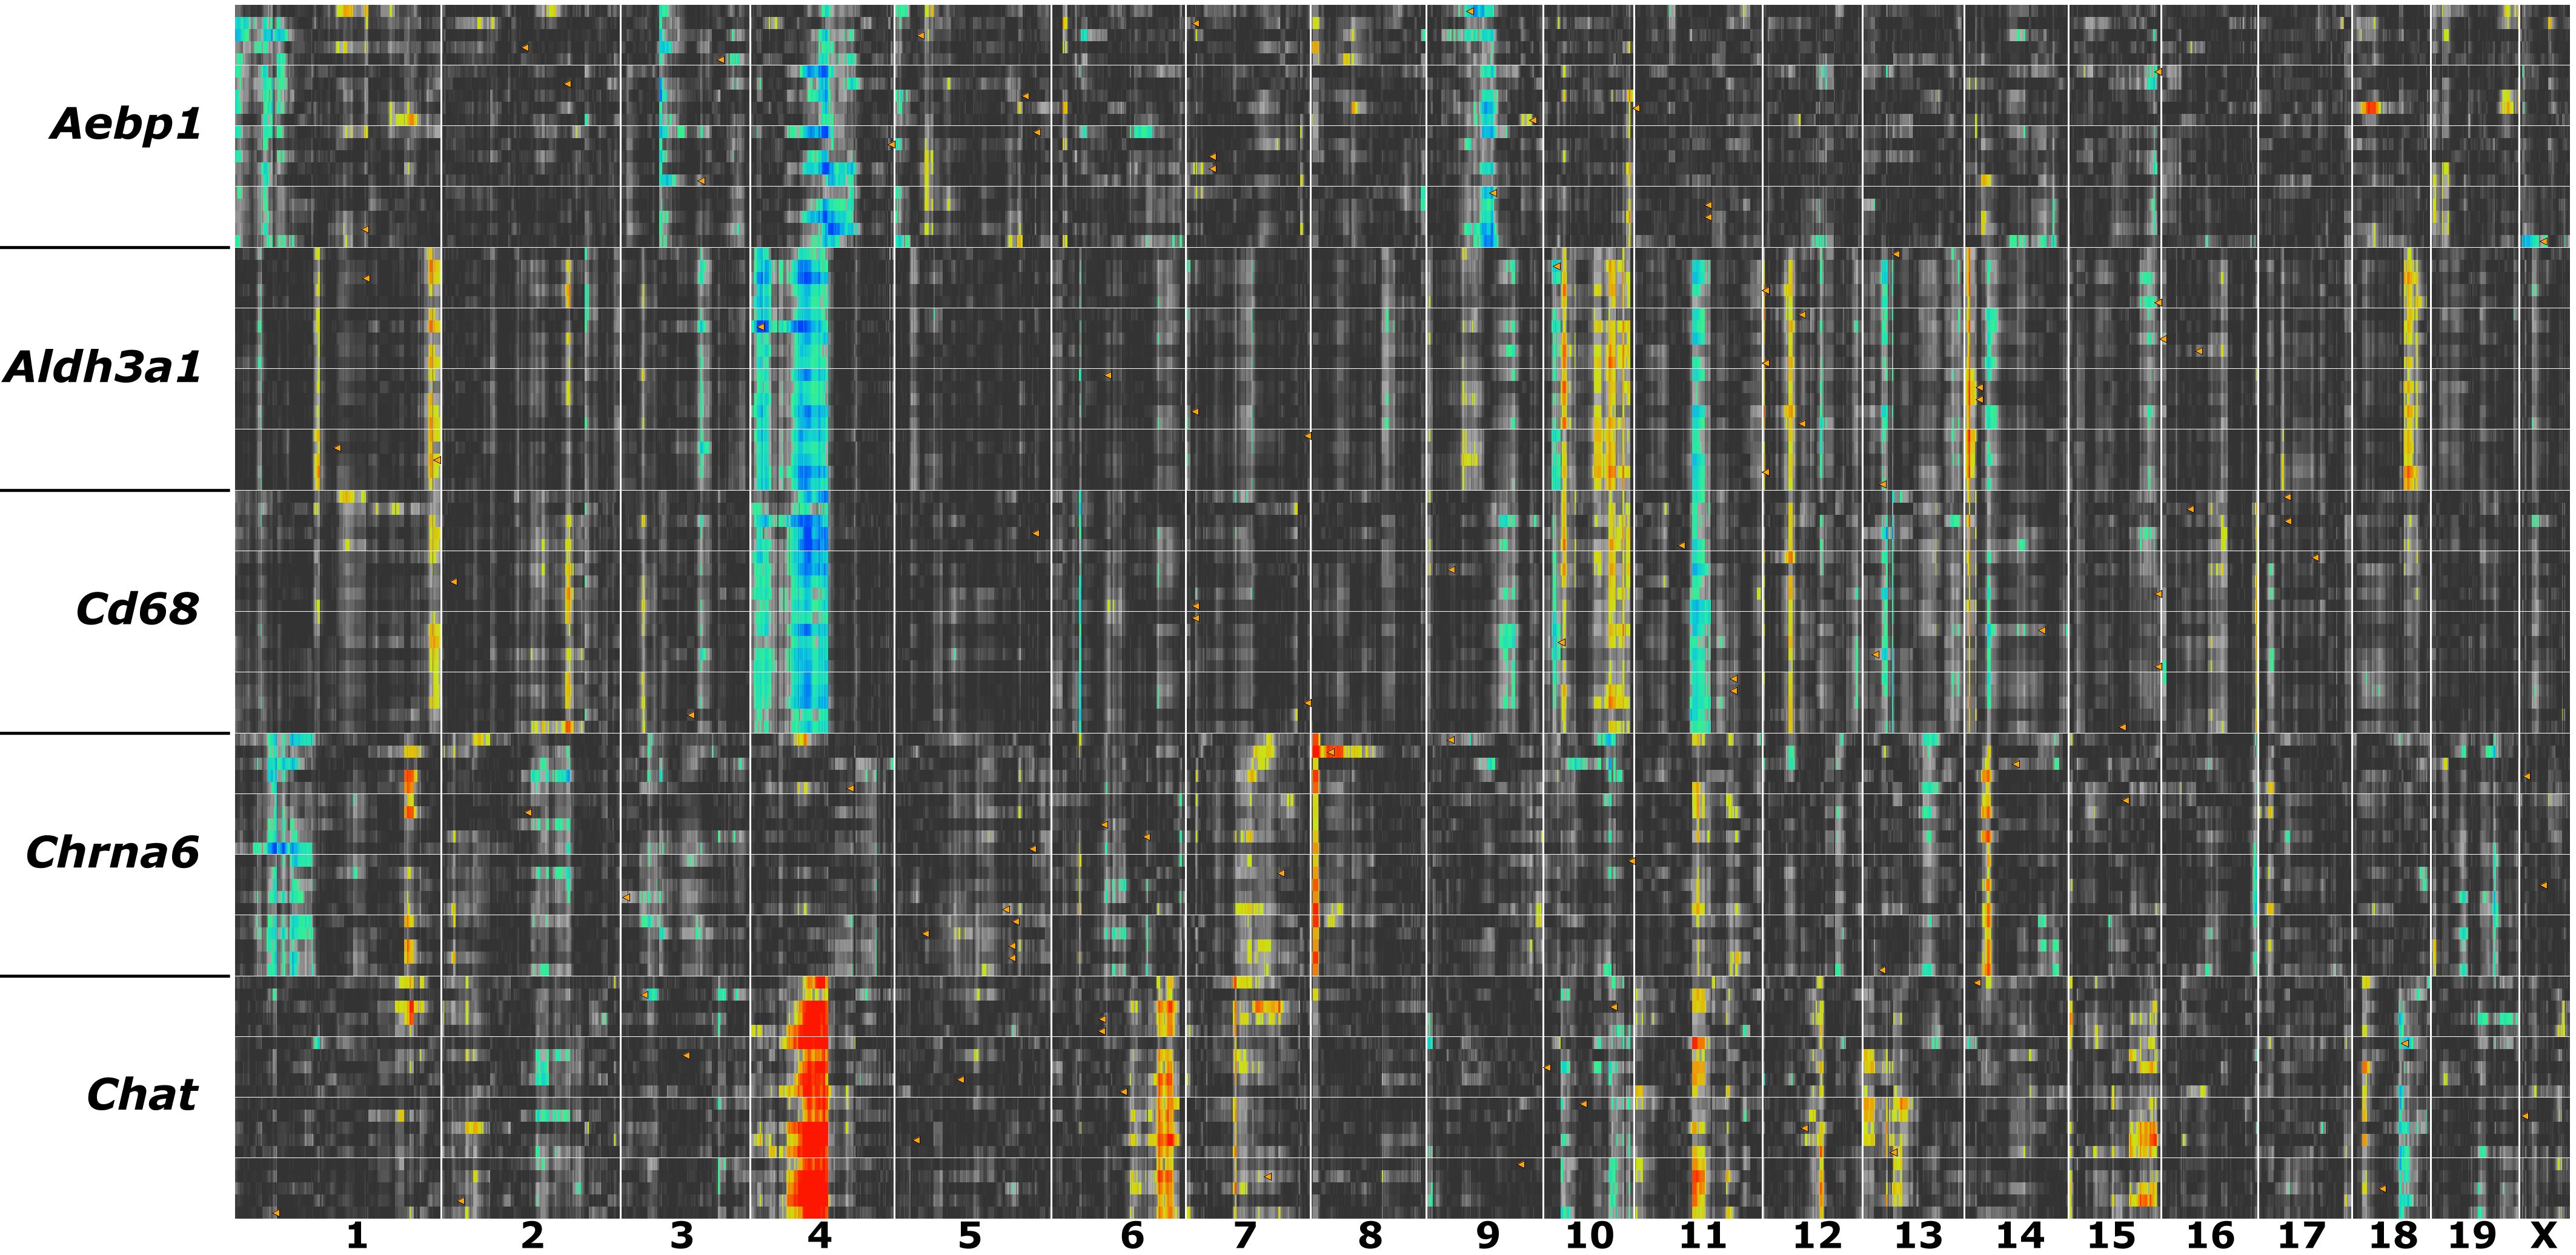
Figure 16. QTL signatures for cells and
tissue types. Five cohorts of transcripts (n=20) were generated using
signature genes listed in
Table 2:
Aebp1 (sclera),
Aldh3a1 (cornea),
Cd68 (anterior segment and
macrophages),
Chrna6 (retinal ganglion cells), and
Chat
(starburst amacrine cells). Each row in this figure is color-coded by
the strength and polarity of genetic control. Chromosome regions that
exert strong control are either blue (
B alleles contribute to
higher expression) or red (
D alleles contribute to higher
expression). Each tissue type has one or more chromosomal regions with
relatively consistent QTL peaks. In contrast, the strong modulation by
a QTL near
Tyrp1 on Chr 4 is a notable feature across several
cell and tissue types. How to identify QTL networks modulating tissue
specific gene expression: Step1. Follow the steps in the legend of
Figure 8
to generate a set of 10 of more transcripts that covary with signature
transcripts listed in
Table 2. Step 2. Place the
transcript data sets into your BXD Trait Collection (maximum is
approximately 100). Step 3. Select traits in your BXD Collection and
click on the '
QTL Heat Map' button.
 Figure 16 of Geisert, Mol Vis 2009; 15:1730-1763.