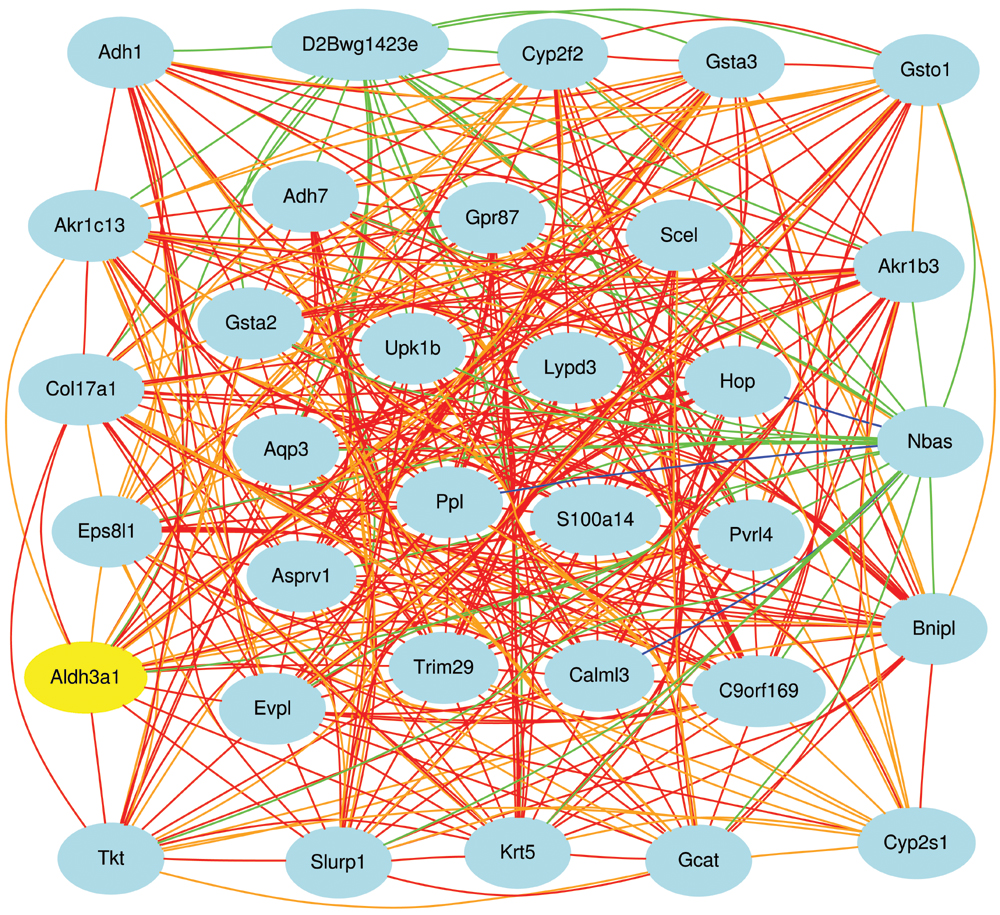
Figure 10. Expression network for cornea.
All transcripts connected by red and orange lines covary with each
other with positive genetic correlations above 0.7 and between 0.5 and
0.7, respectively. Blue and green lines are the corresponding negative
correlations.
How to
generate this figure: Step 1. Follow the steps in the legend to
Figure 8
to generate a correlation of transcripts, in this case using signatures
from
Table 2
such as
Aldh3a1. Step 2. Select no more than 100 of these
transcripts using the check boxes to the left of each transcript or
trait and use the '
Add to Collection' button to move the
selected traits into your Trait Collection window. Step 3. Click on the
'Network Graph' button. Step 4. Adjust the control parameters of the
graph.
 Figure 10 of Geisert, Mol Vis 2009; 15:1730-1763.