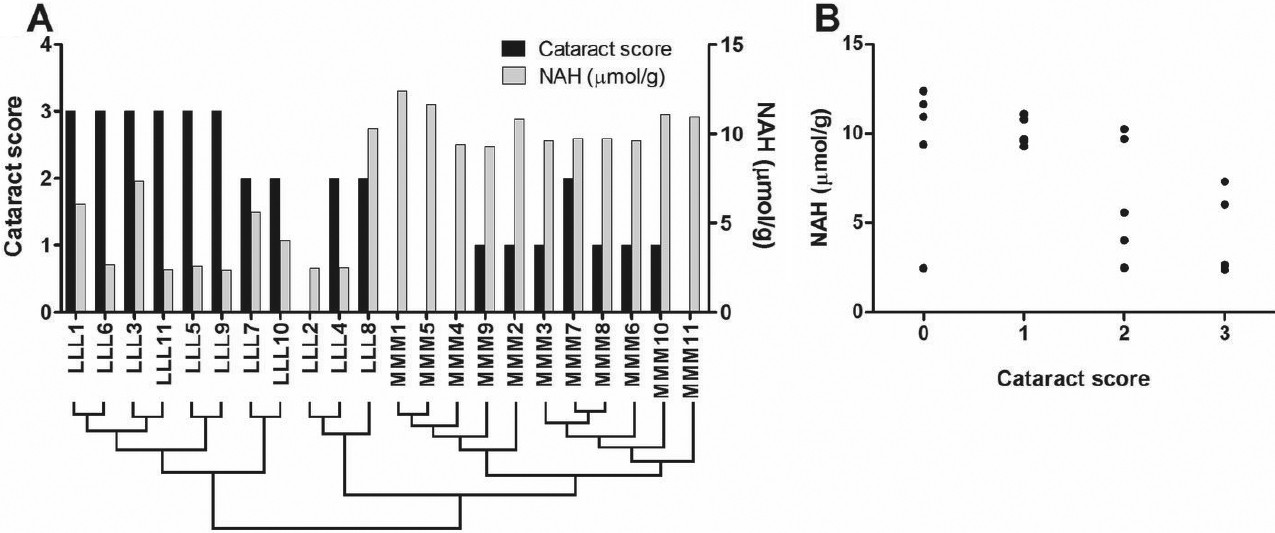
Figure 2. Individual cataract scores and
N-acetyl histidine (NAH) concentrations in lenses of the fish used for
microarray analysis. The right lens of the fish was used for microarray
analysis, and thus the cataract scores (on a scale from 0 to 4) of the
right lens are presented in the graphs. The NAH concentrations were
determined in the left lens of the same fish.
A: Cataract
scores and NAH concentrations for the individual samples are shown in
this graph. Under the sample names, the sample clustering (obtained by
hierarchical clustering of genes and samples, see
Figure 4)
is shown to relate individual cataract scores and NAH concentrations to
gene expression patterns (the closer the samples are in the cluster
tree, the more similar is the lens transcriptome).
B: Lens NAH
concentrations were significantly negatively correlated to the cataract
scores of the right lens (Spearman rank test; r=−0.63, p<0.002,
n=22).
 Figure 2 of Tröße, Mol Vis 2009; 15:1332-1350.