Figure 4. Hierarchical clustering of samples and transcripts. The samples are arranged in columns, and the transcripts are arranged
in rows. Only the transcripts with a q-value of 0% in the SAM list were clustered. Negative log intensity ratios are shown
in green and positive log intensity ratios are shown in red in the heat map as indicated by the color bar. The blue color
represents missing values. The transcripts divide into two distinct clusters. The first cluster contains the transcripts that
are up-regulated in the low-His group compared to the medium-His group and is marked by a red bar at the right side of the
heat map. The second cluster contains the down-regulated transcripts and is marked by a green bar at the right side of the
heat map. The samples divide into three main clusters, reflecting the His feeding regimes. Low-His samples are clearly separated
from medium-His samples.
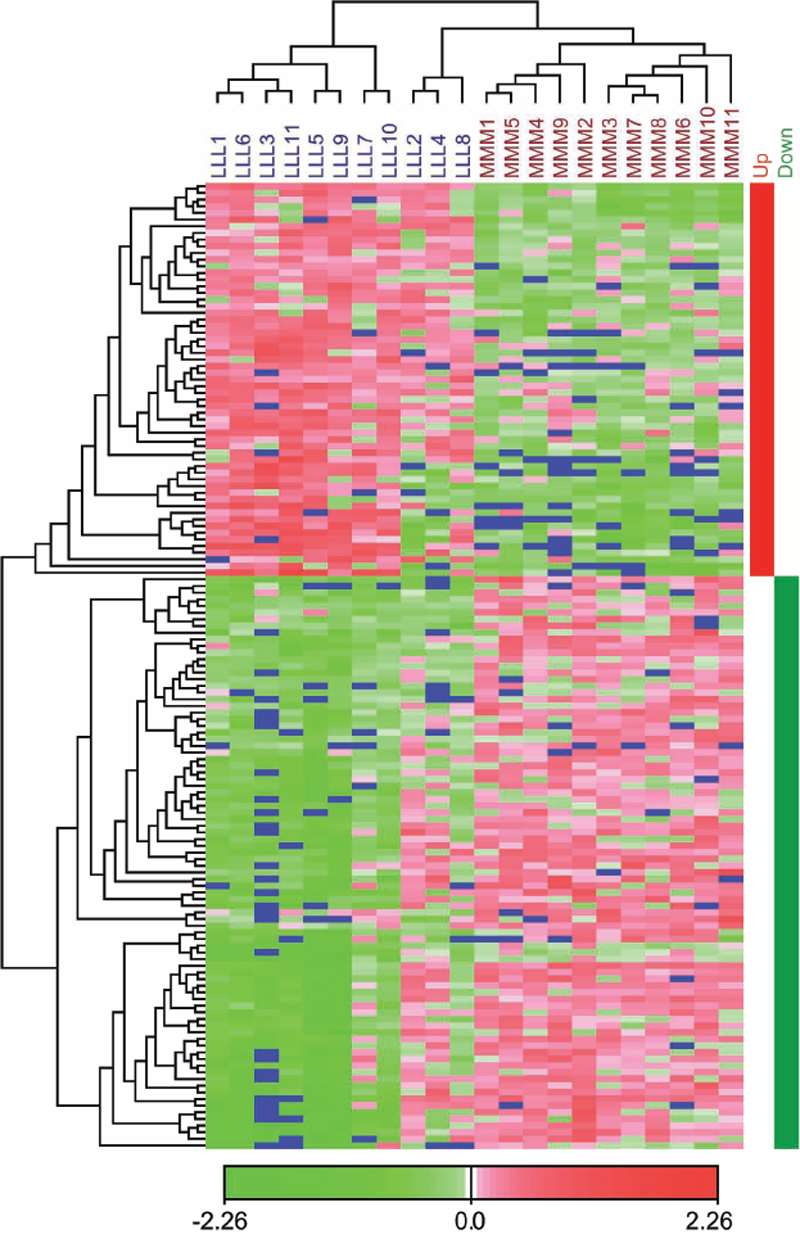
 Figure 4 of
Tröße, Mol Vis 2009; 15:1332-1350.
Figure 4 of
Tröße, Mol Vis 2009; 15:1332-1350.