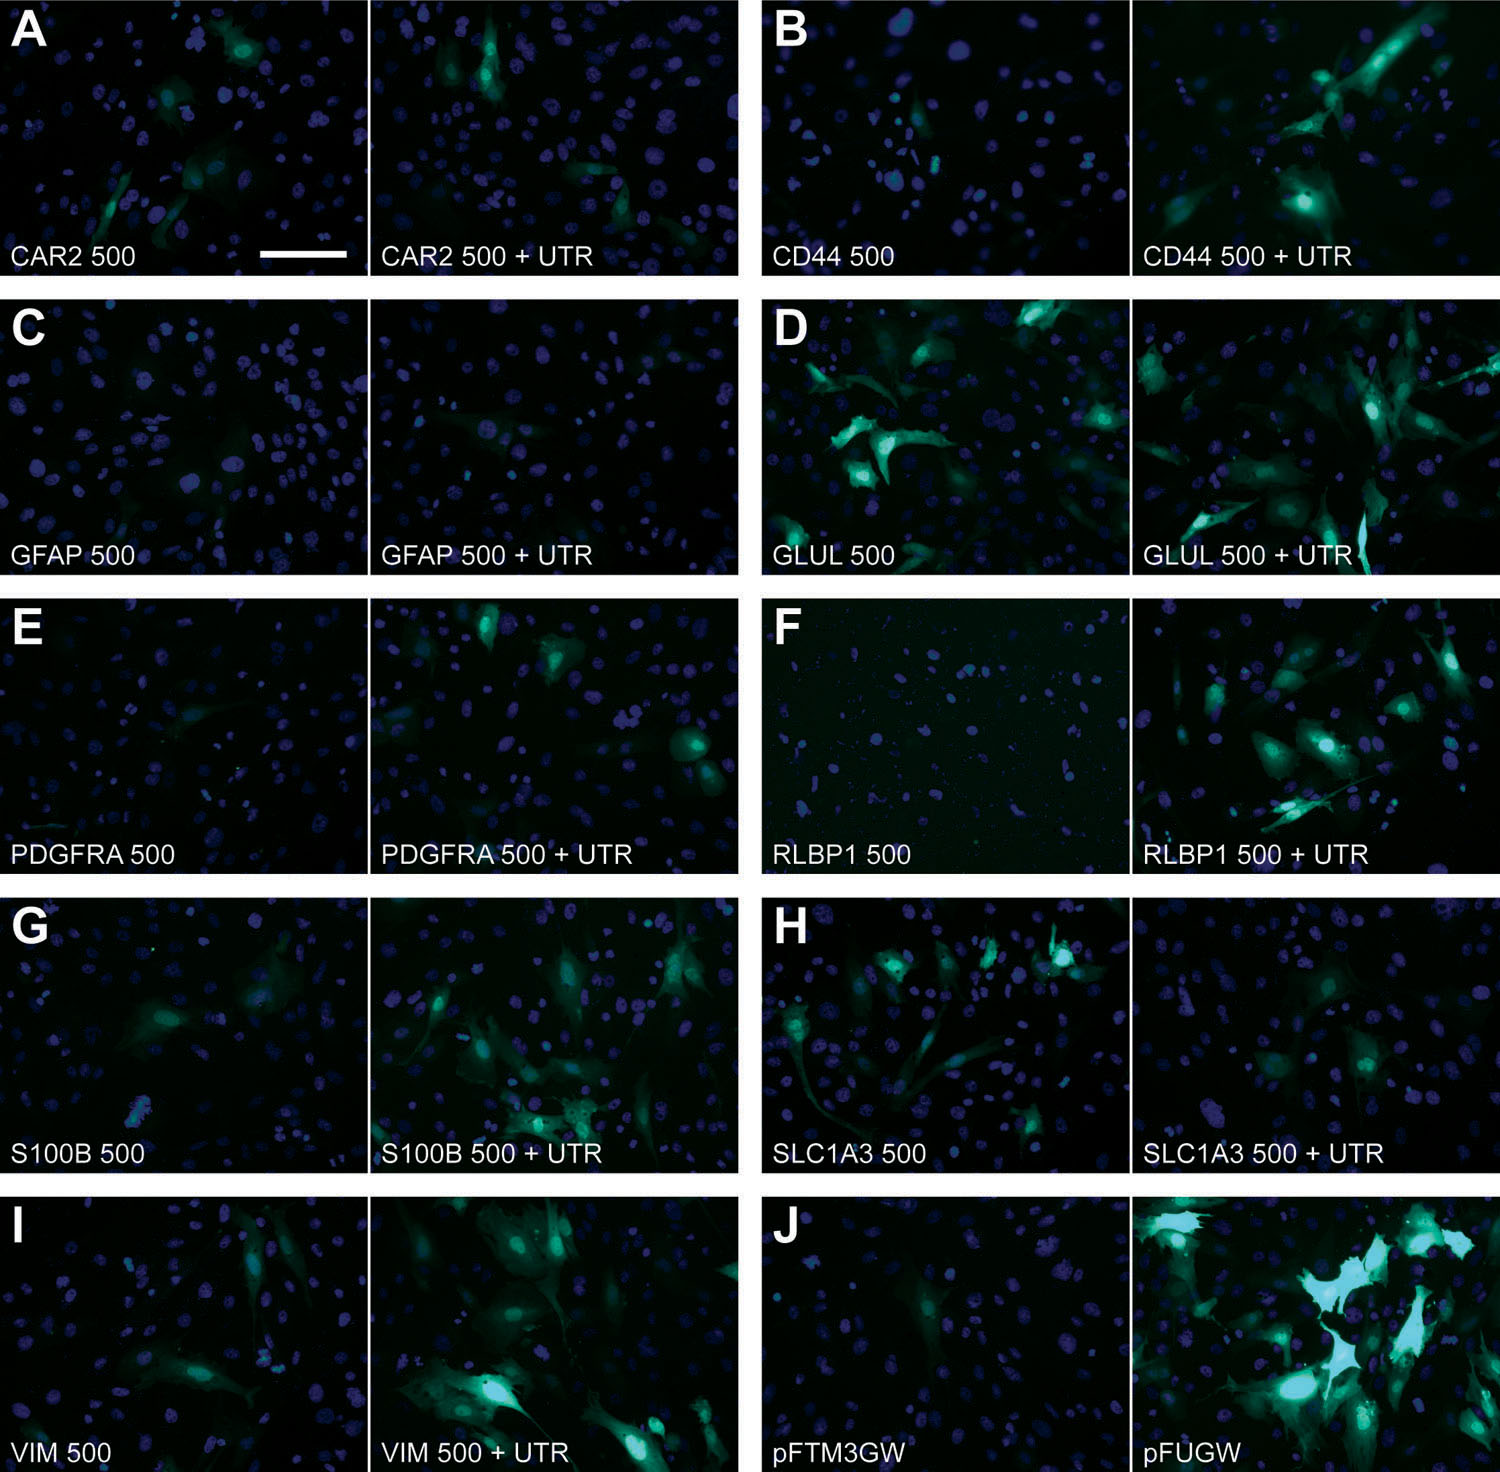
Figure 3. The choice of gene promoter and
the presence of the gene’s 5′ untranslated region influence the level
of reporter gene expression in cultured rat Müller cells. Microscopic
analysis is in agreement with the flow cytometry data (
Figure 2),
and therefore serves as a rapid, qualitative approach to screening
experimental promoters. eGFP expression is demonstrated for the 500 bp
promoter fragments either with (right) or without (left) the 5′ UTR for
each of the nine genes analyzed (
A-I). Shown in (
J) are
control transfections with the backbone vector (pFTM3GW; left), or a
vector containing the 1178 bp human ubiquitin-C promoter (pFUGW;
right). Scale bar in (
A) equals 10 µm.
 Figure 3 of Geller, Mol Vis 2008; 14:691-705.