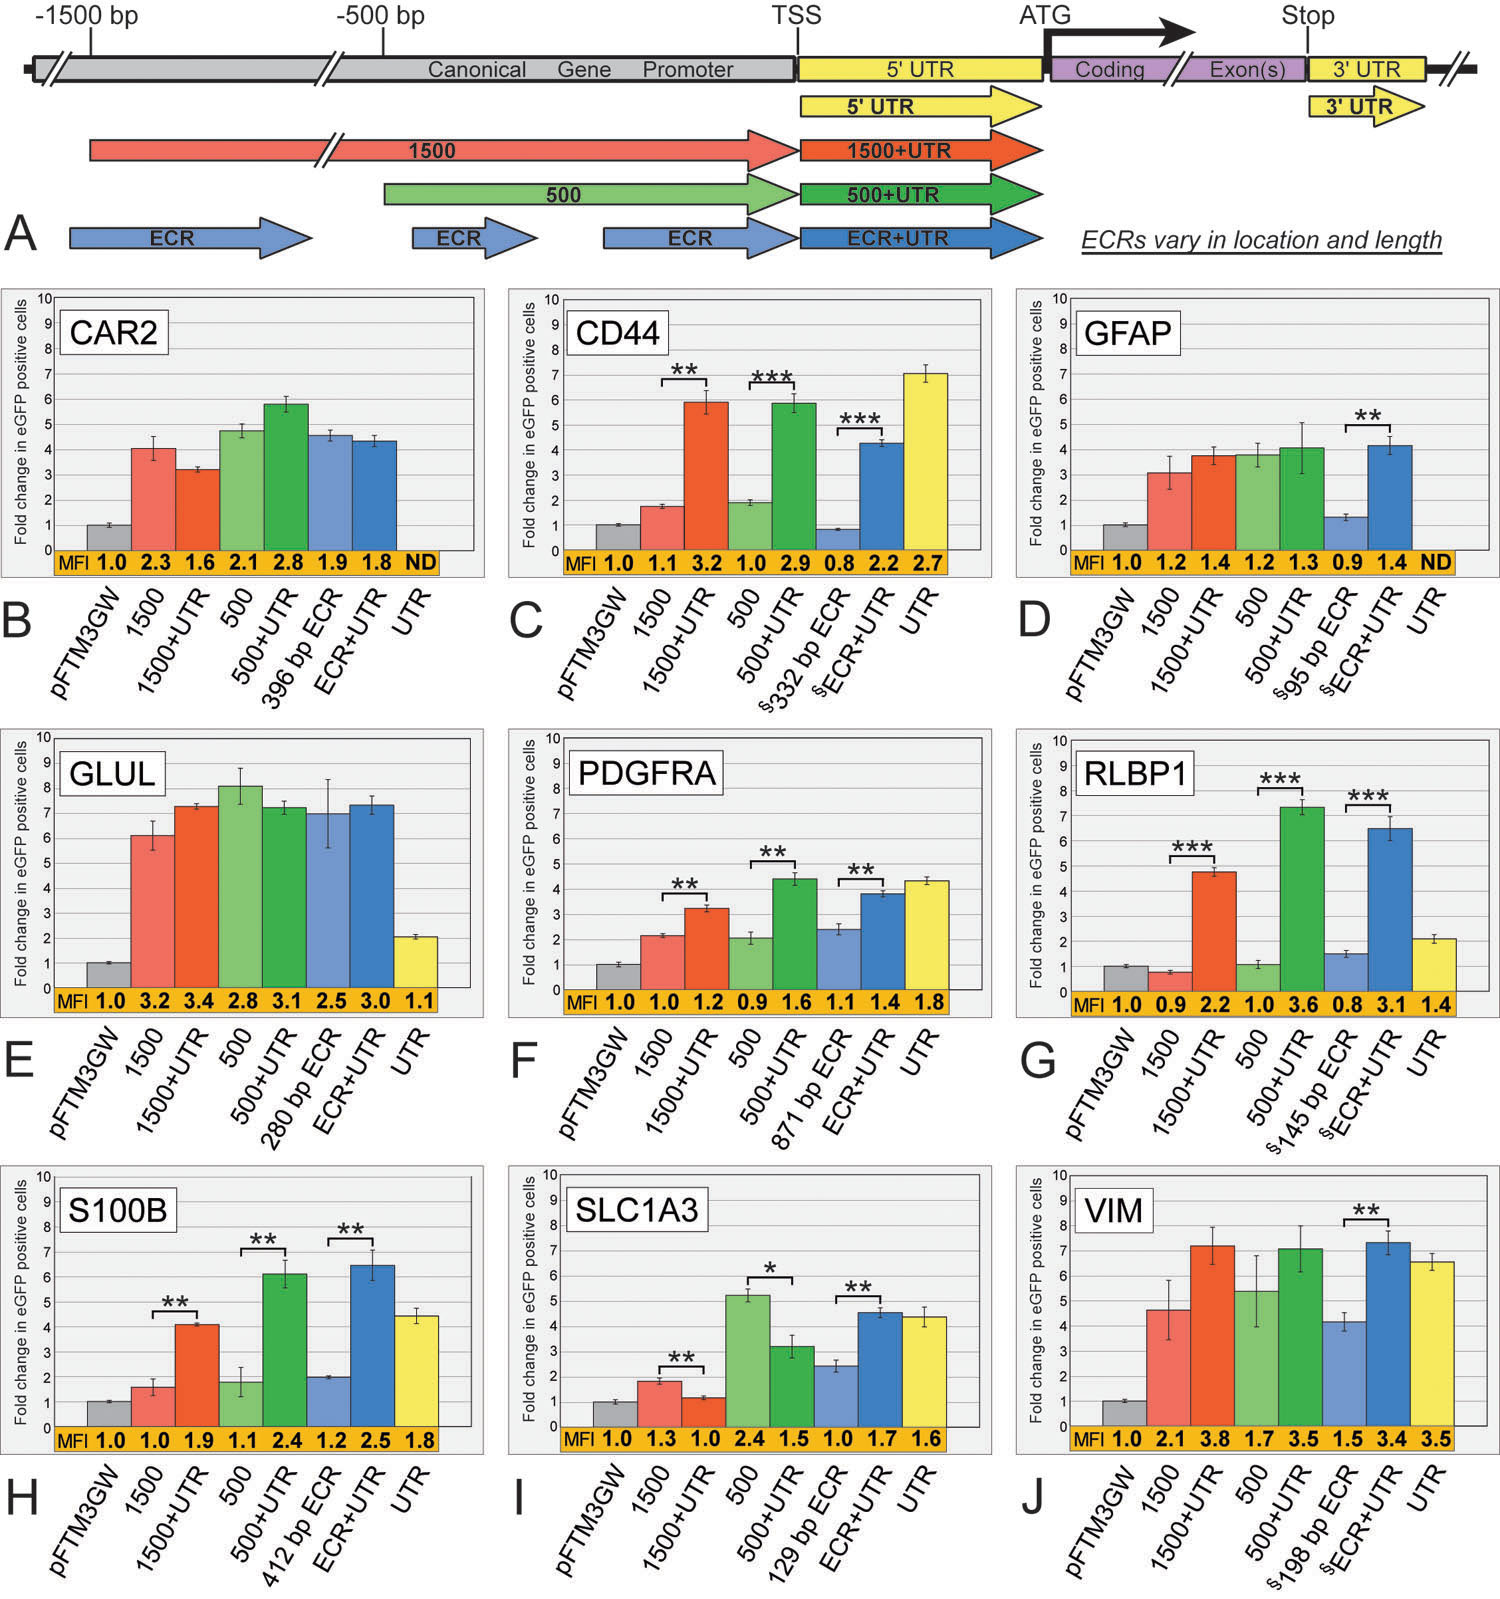
Figure 2. Flow cytometry analysis of
promoter fragments from nine Müller cell expressed genes.
A:
Diagrammatic representation of DNA fragments analyzed here and in
subsequent figures.
B-J: Significant variability in both number
of positive cells and fluorescence intensity are apparent among the 61
fragments tested. Seven fragments were analyzed for each gene: the 5′
UTR alone (yellow), a ~1500 bp (red), a ~500 bp (green), and a
variable-sized evolutionarily conserved region (ECR; blue), each with
and without their respective 5′ UTRs. Bars indicate fold change in
number of eGFP positive cells, normalized to the promoter-less parent
vector (pFTM3GW). The mean fluorescence intensity (MFI) for each
construct was also normalized to the parent vector (pFTM3GW) and is
shown immediately below each bar (shown in orange). UTRs for the
GFAP
(14 bp) and
CAR2 (28 bp) genes were quite short and not
individually tested. Both the locationrelative to the transcriptional
start site (TSS), and the size of the ECRs vary for each gene (official
gene names can be found in Introduction). Refer to
Appendix 1
for genomic coordinates of each construct. The symbol (§) identifies
ECRs that were not immediately adjacent to the TSS (
CD44,
GFAP,
RLBP1, and
VIM), and less-conserved DNA between the ECR
and TSS was included for each of these constructs. ATG is the codon for
the starting methionine. Error bars represent 1 standard deviation. The
single asterisk equals p<0.01, the double asterisk equals
p<0.001, and the triple asterisk equals p<0.0001, using a
two-tailed Student's
t-test assuming equal variances. ND means
“not determined.”
 Figure 2 of Geller, Mol Vis 2008; 14:691-705.