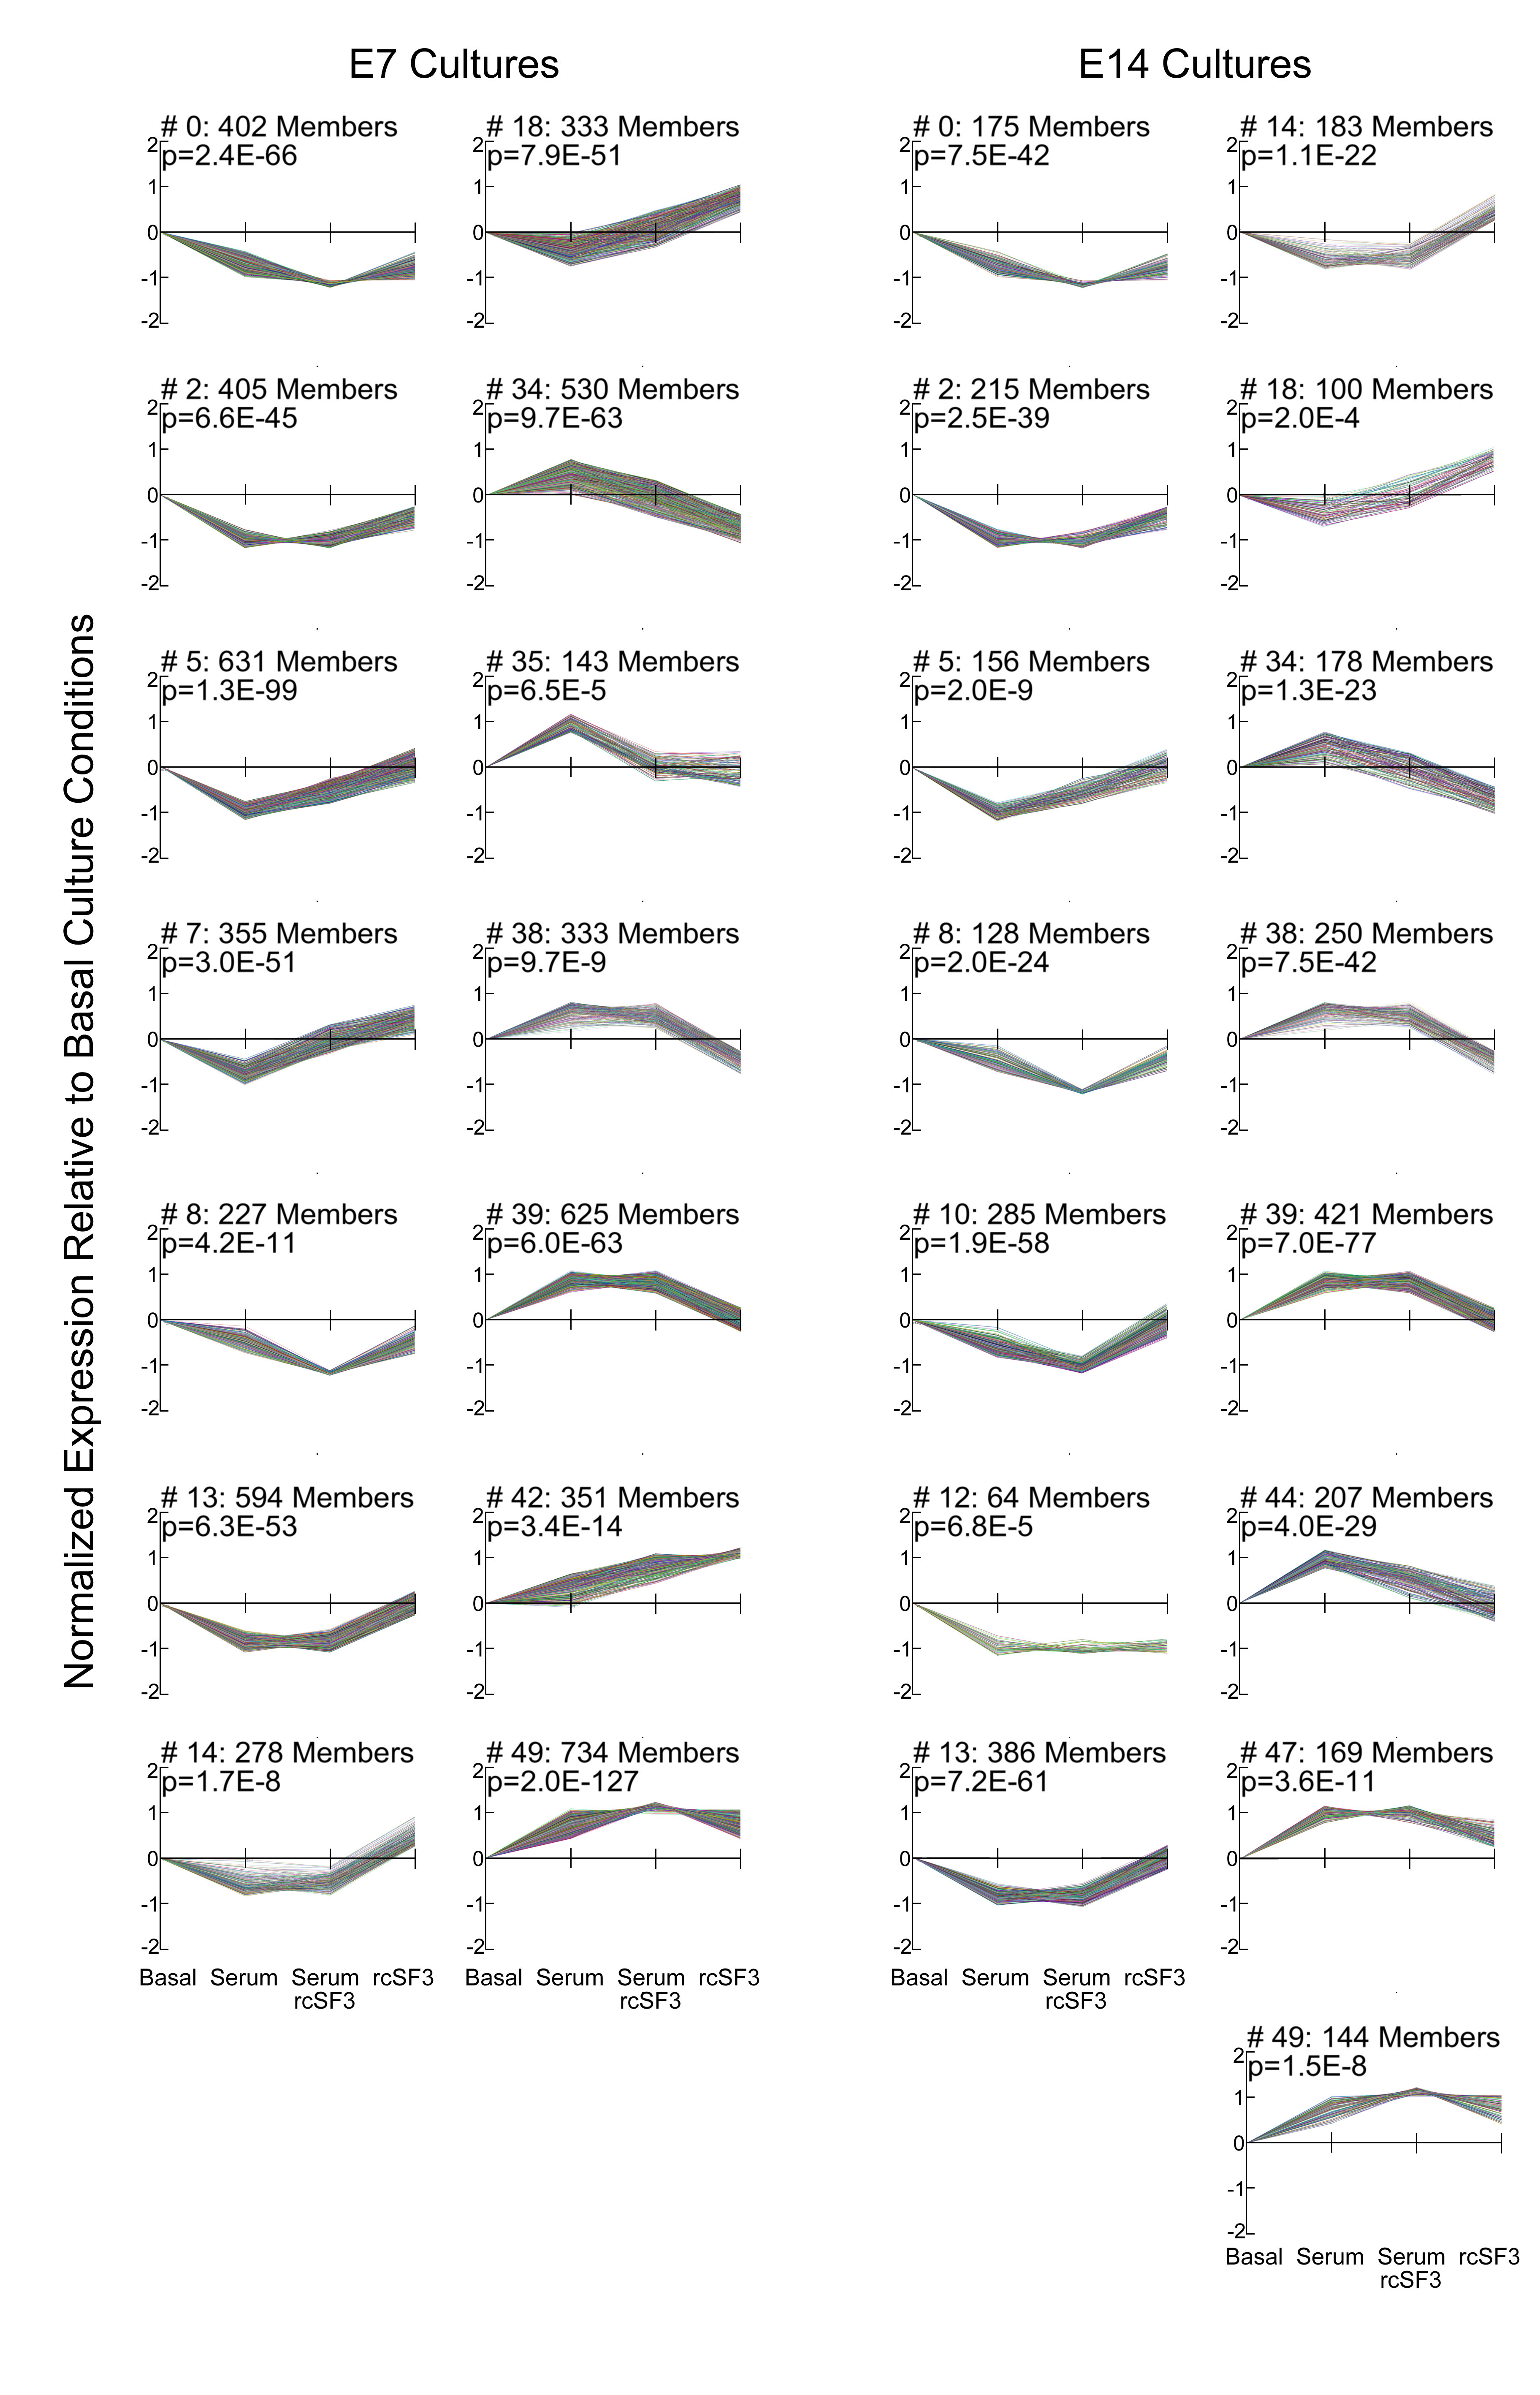
Figure 2. Genes clustered according to
expression level in different culture conditions. The x-axis follows
the order of
Figure
1. Expression was compared to basal culture conditions (SF3
in the apical chamber and SF2 in the basal chamber). As indicated on
the x-axis, cultures were supplemented with 2% fetal calf serum or
rcSF3 replaced SF3. Data were transformed to allow high-expressing and
low-expressing genes to be represented on the same graph. The p value
from the statistical analysis and number of members for each cluster
are indicated. Cluster memberships are listed in the
Appendix 2.
As summarized in
Table
2, some gene clusters were affected by only serum or only
rcSF3, but many clusters indicated interactions between these two
stimuli.
 Figure 2 of Sun, Mol Vis 2008; 14:2237-2262.