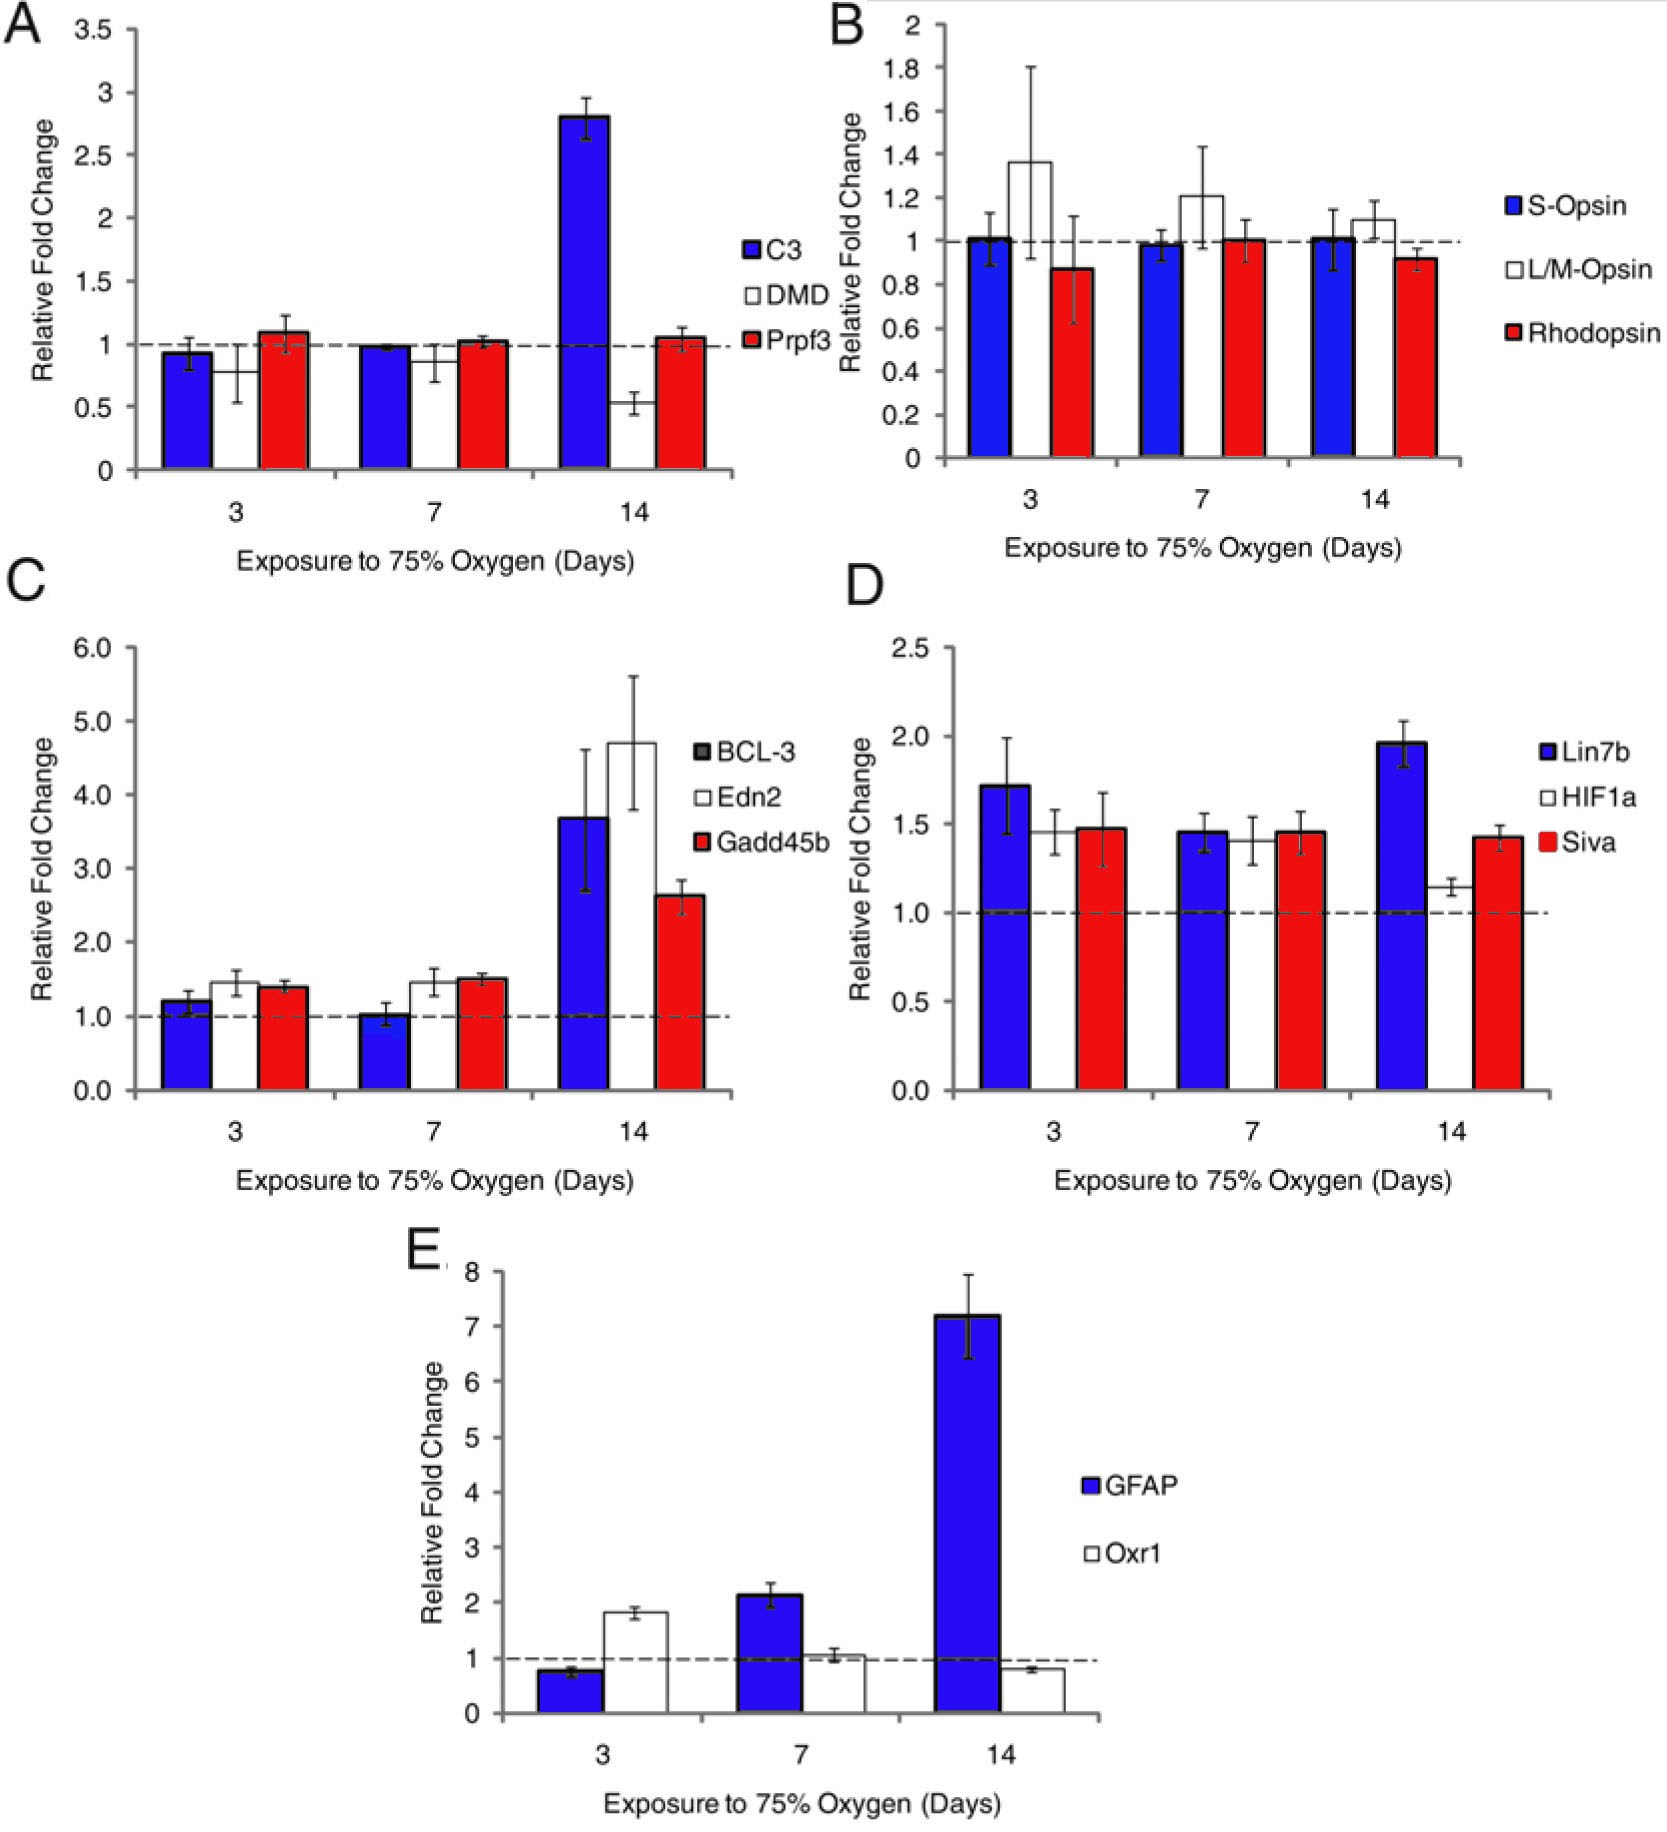
Figure 2. Assessment by qPCR of expression
changes in genes identified by microarray analysis as
hyperoxia-regulated. As noted for
Table 5, these data validate
trends in the Genechip data.
A: Validation of human retinal
disease genes showing upregulation of C3, downregulation of DMD and no
change to Prpf3.
B: Control genes (opsins) which showed no
change in expression.
C-E: Additional sets of genes assessed by
qPCR.
C shows a group of three genes upregulated at 14 day.
D
shows a group upregulated at all time points;
E shows contrasts
a gene (Oxr1) upregulated at 3 day, with GFAP, which is maximally
upregulated at 14 day. For each gene, the fold change in expression was
determined using 0 day expression as control and normalizing the data
to the housekeeping gene GAPDH. Fold changes below the dashed line
indicate expression decrease while above the line indicate expression
increase. Error bars show standard error of the mean.