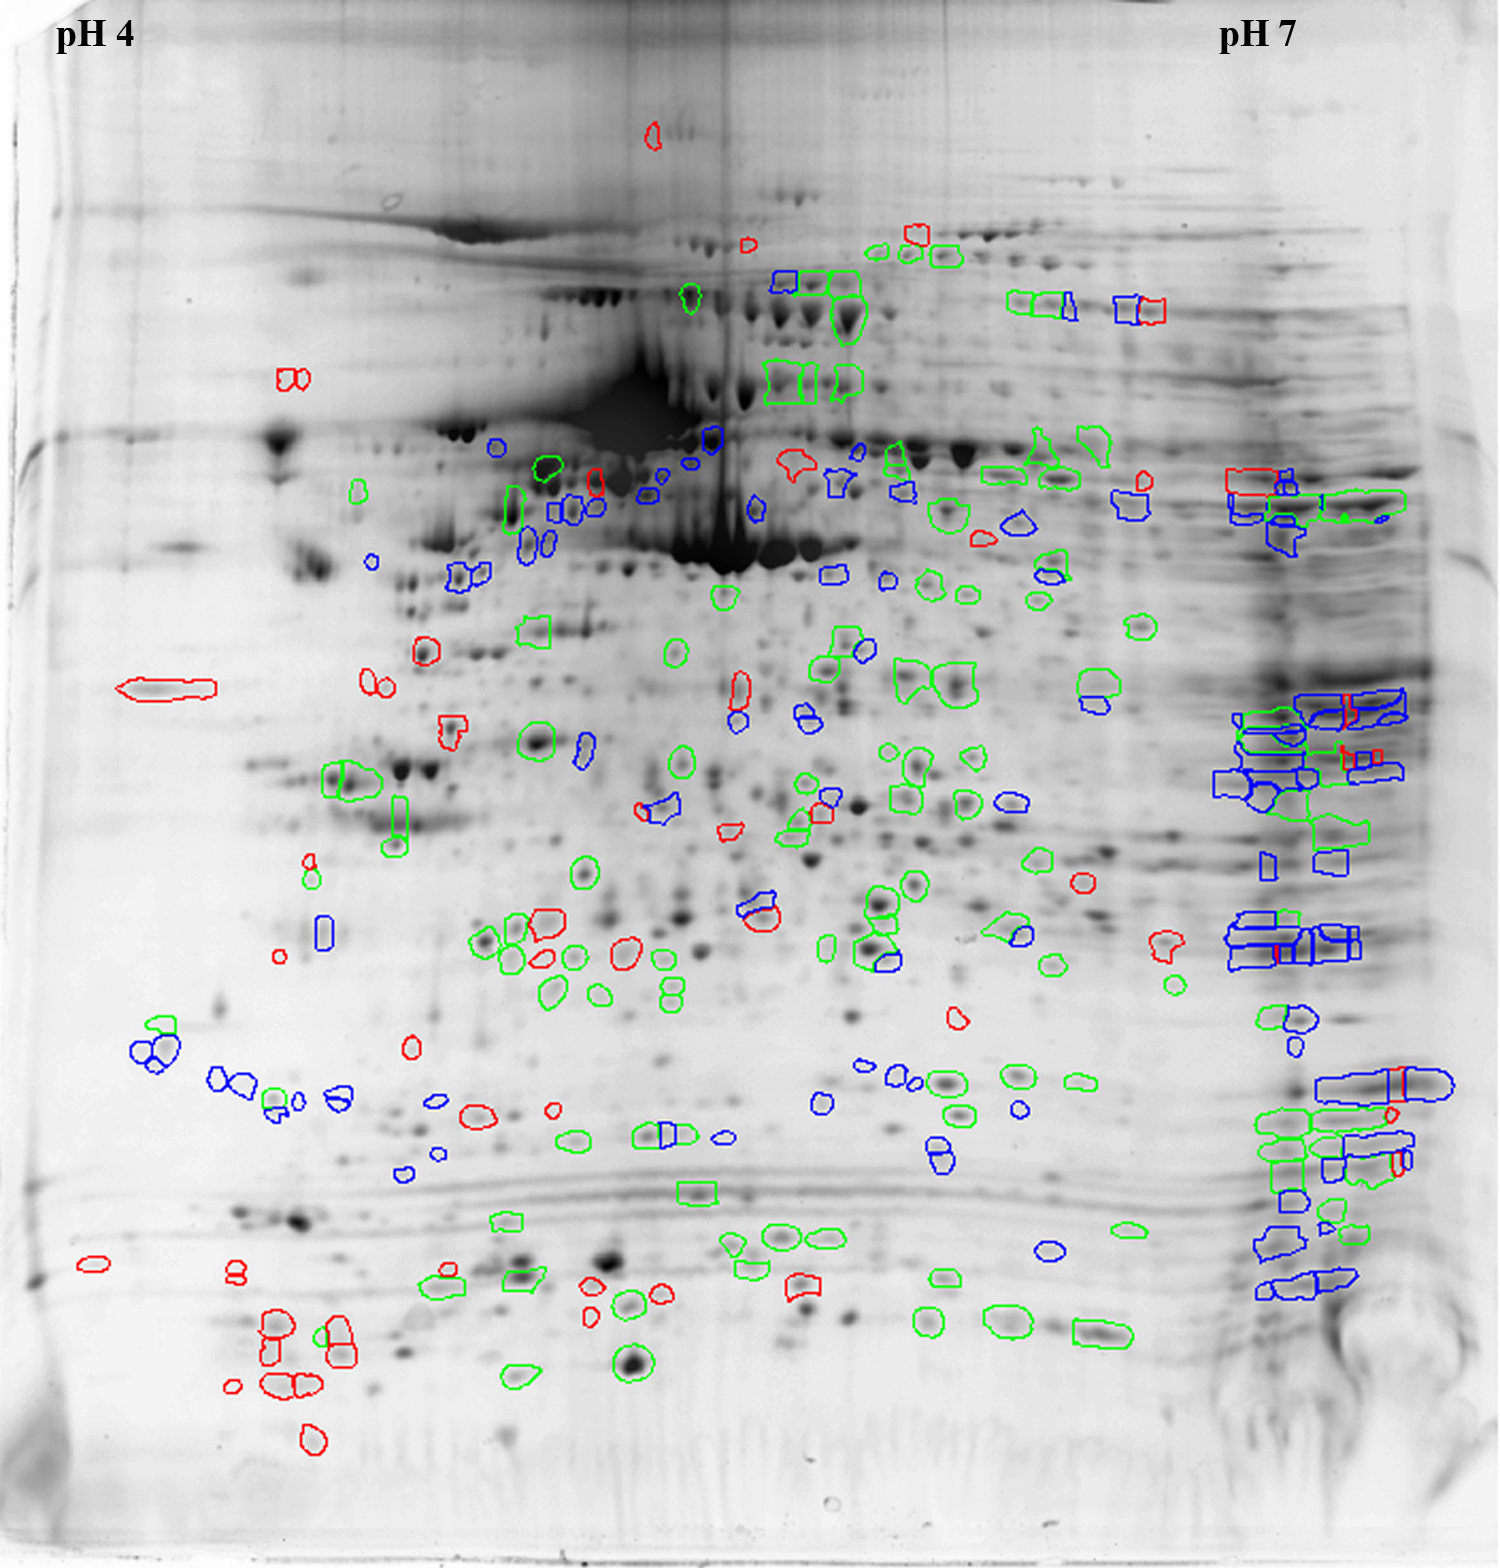
Figure 3. Relative differences in protein
expression between human corneal endothelial cells cultured from young
and older donors. The same 2-D gel from the young donor shown in
Figure 2C has
been enlarged and color-coded by the analysis software to indicate
individual proteins spots that show differences in relative protein
expression. Spots with no color designation indicate similar expression
within a twofold range. Green indicates spots that were increased by
twofold or greater in cells from young donors compared to older donors.
Red indicates spots that were twofold decreased in young donors
compared with older donors. Blue shows those spots that were present in
extracts from young donors but were not detected in extracts from older
donors.