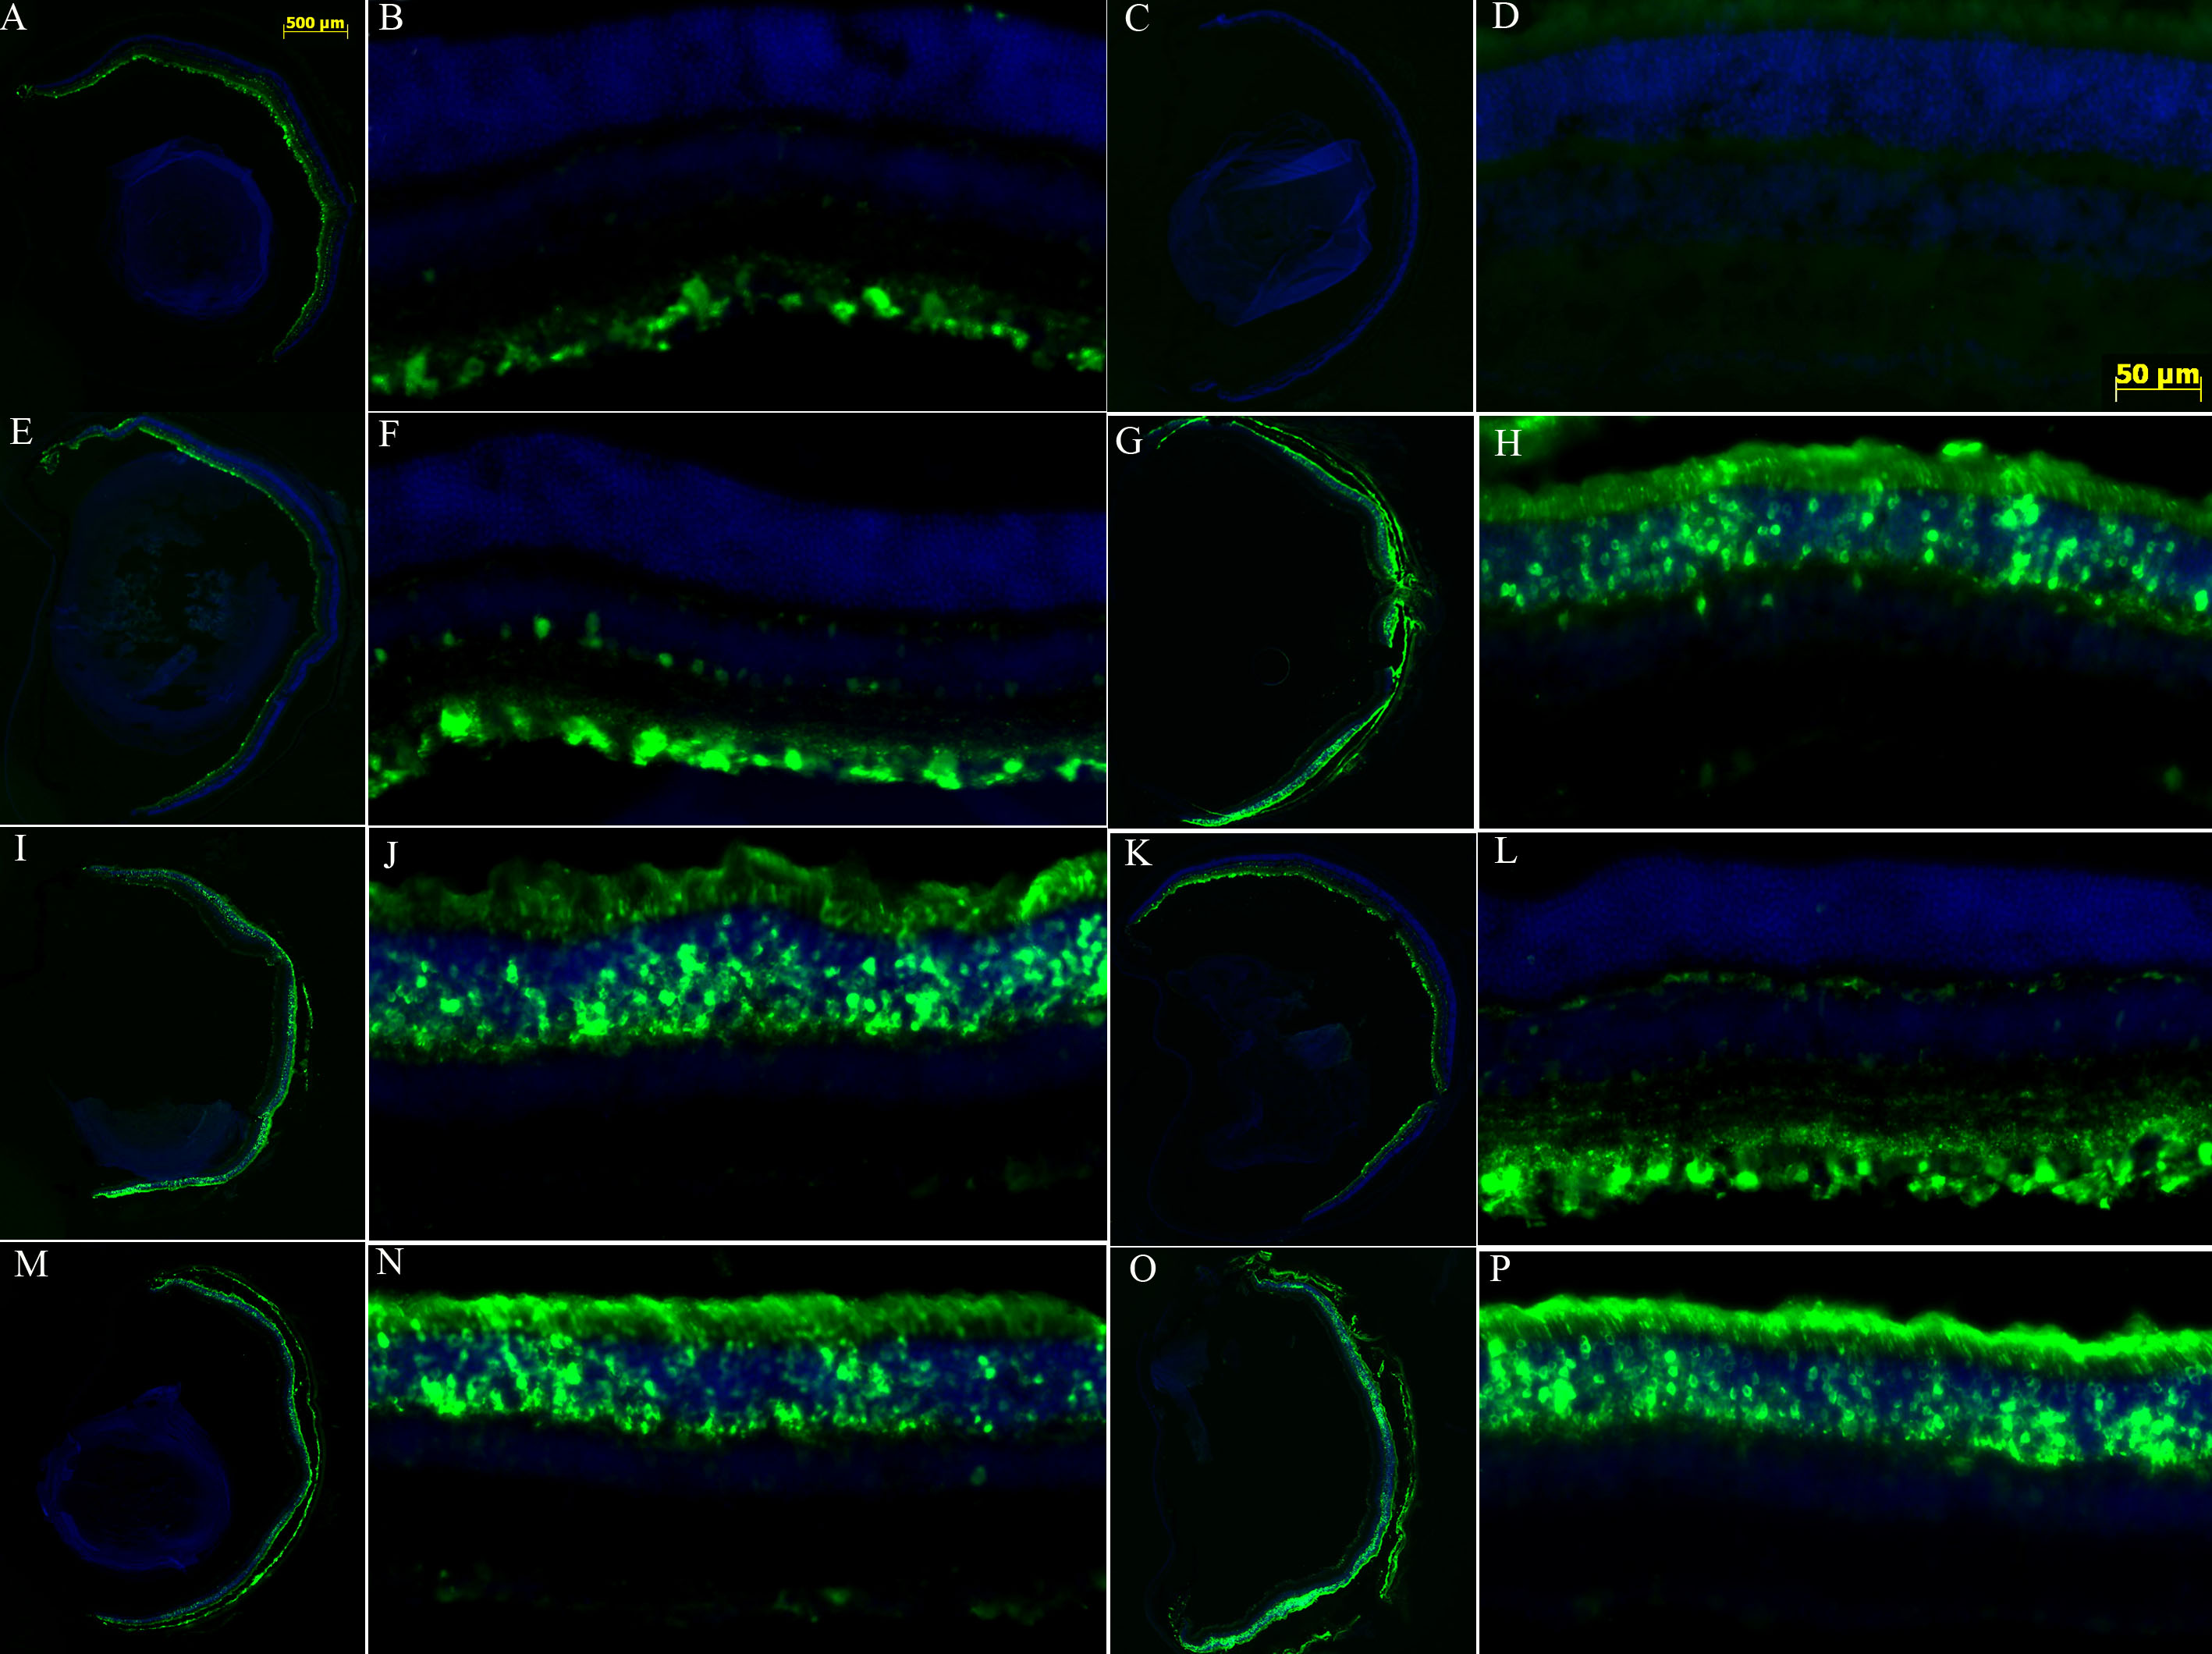
Figure 2. GFP expression in retinas
receiving different routes of intraocular vector sequentially in
partner eyes. Representative images of retinas from each treatment
group listed in
Table
1 are shown in the same order.
A, B, E, F, I, J, M,
and
N show retinas that received first eye vector injections.
C,
D, G, H, K, L, O, and
P present retinas that received
second eye vector injections.
A-D show retinas that received
two sequential intravitreal injections (IV-IV) vector injections.
E-H
are from retinas that were given two sequential injections with first
eye injected intravitreally and second subretinally (IV-SR) vector
injections.
I-L present retinas that received two sequential
injections with first eye injected subretinally and second
intravitreally (SR-IV) vector injections.
M-P represent retinas
that received two sequential subretinal injections (SR-SR) vector
injections. A low-magnification image from each eye is shown on the
right for each treatment group with a higher magnification image from
the same eye next to it on the right (e.g., image
B is taken
from
A, image
D is taken from
C, and so forth).
 Figure 2 of Li, Mol Vis 2008; 14:1760-1769.