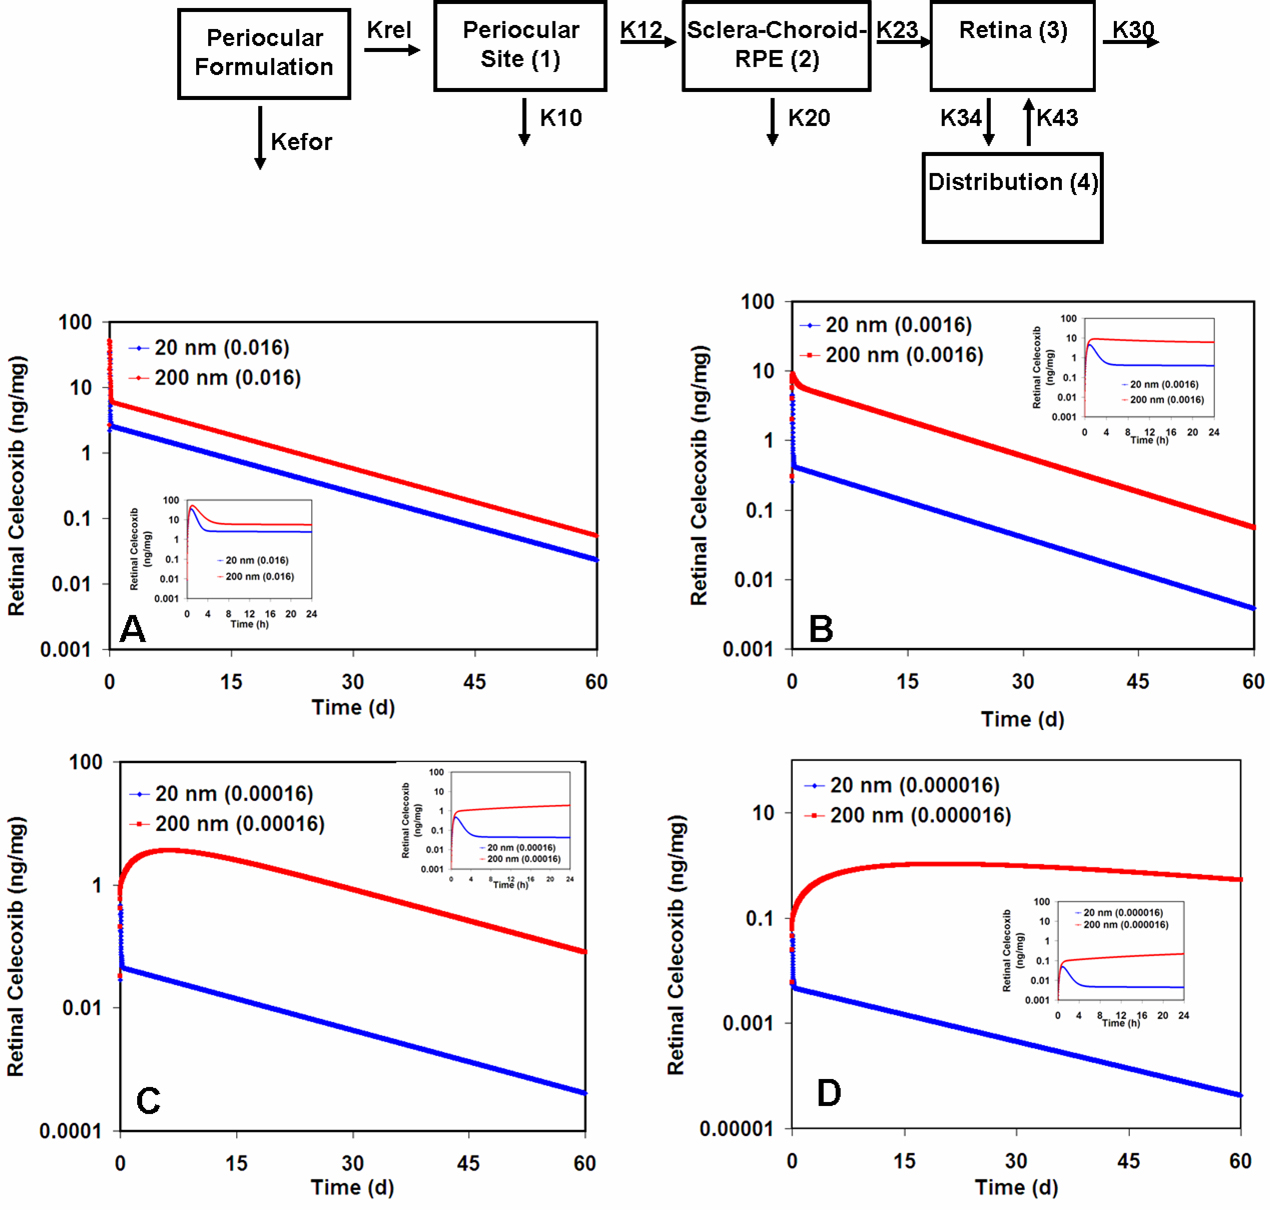
Figure 9. Sustained retinal delivery of a model drug (celecoxib) from nanoparticles with different clearance rates and drug release
rates. The profiles were simulated for 20 nm and 200 nm particles for a period of 60 days. The elimination rate of the 20
nm formulation was obtained by curve fitting to the previously published data [
12]. The estimated elimination half-life for 20 nm particles was 5.5 h. The elimination half-life for the 200 nm particles was
assumed to be 180 days since they persisted almost completely for at least two months in the periocular space [
12]. All other model parameters used in the model are shown in
Table 1. The structural model is shown above the simulation. The panels depict profiles of 20 and 200 nm particles with a release
rate constant of 0.016 min
−1 (
A), profiles of 20 and 200 nm particles with a release rate constant of 0.0016 min
−1 (
B), profiles of 20 and 200 nm particles with a release rate constant of 0.00016 min
−1 (
C), and profiles of 20 and 200 nm particles with a release rate constant of 0.000016 min
−1 (
D). The insets in each panel are the profiles for the first 24 h of drug release to better show the early differences between
the retinal concentrations of celecoxib using 20 and 200 nm particles.
 Figure 9 of
Amrite, Mol Vis 2008; 14:150-160.
Figure 9 of
Amrite, Mol Vis 2008; 14:150-160.