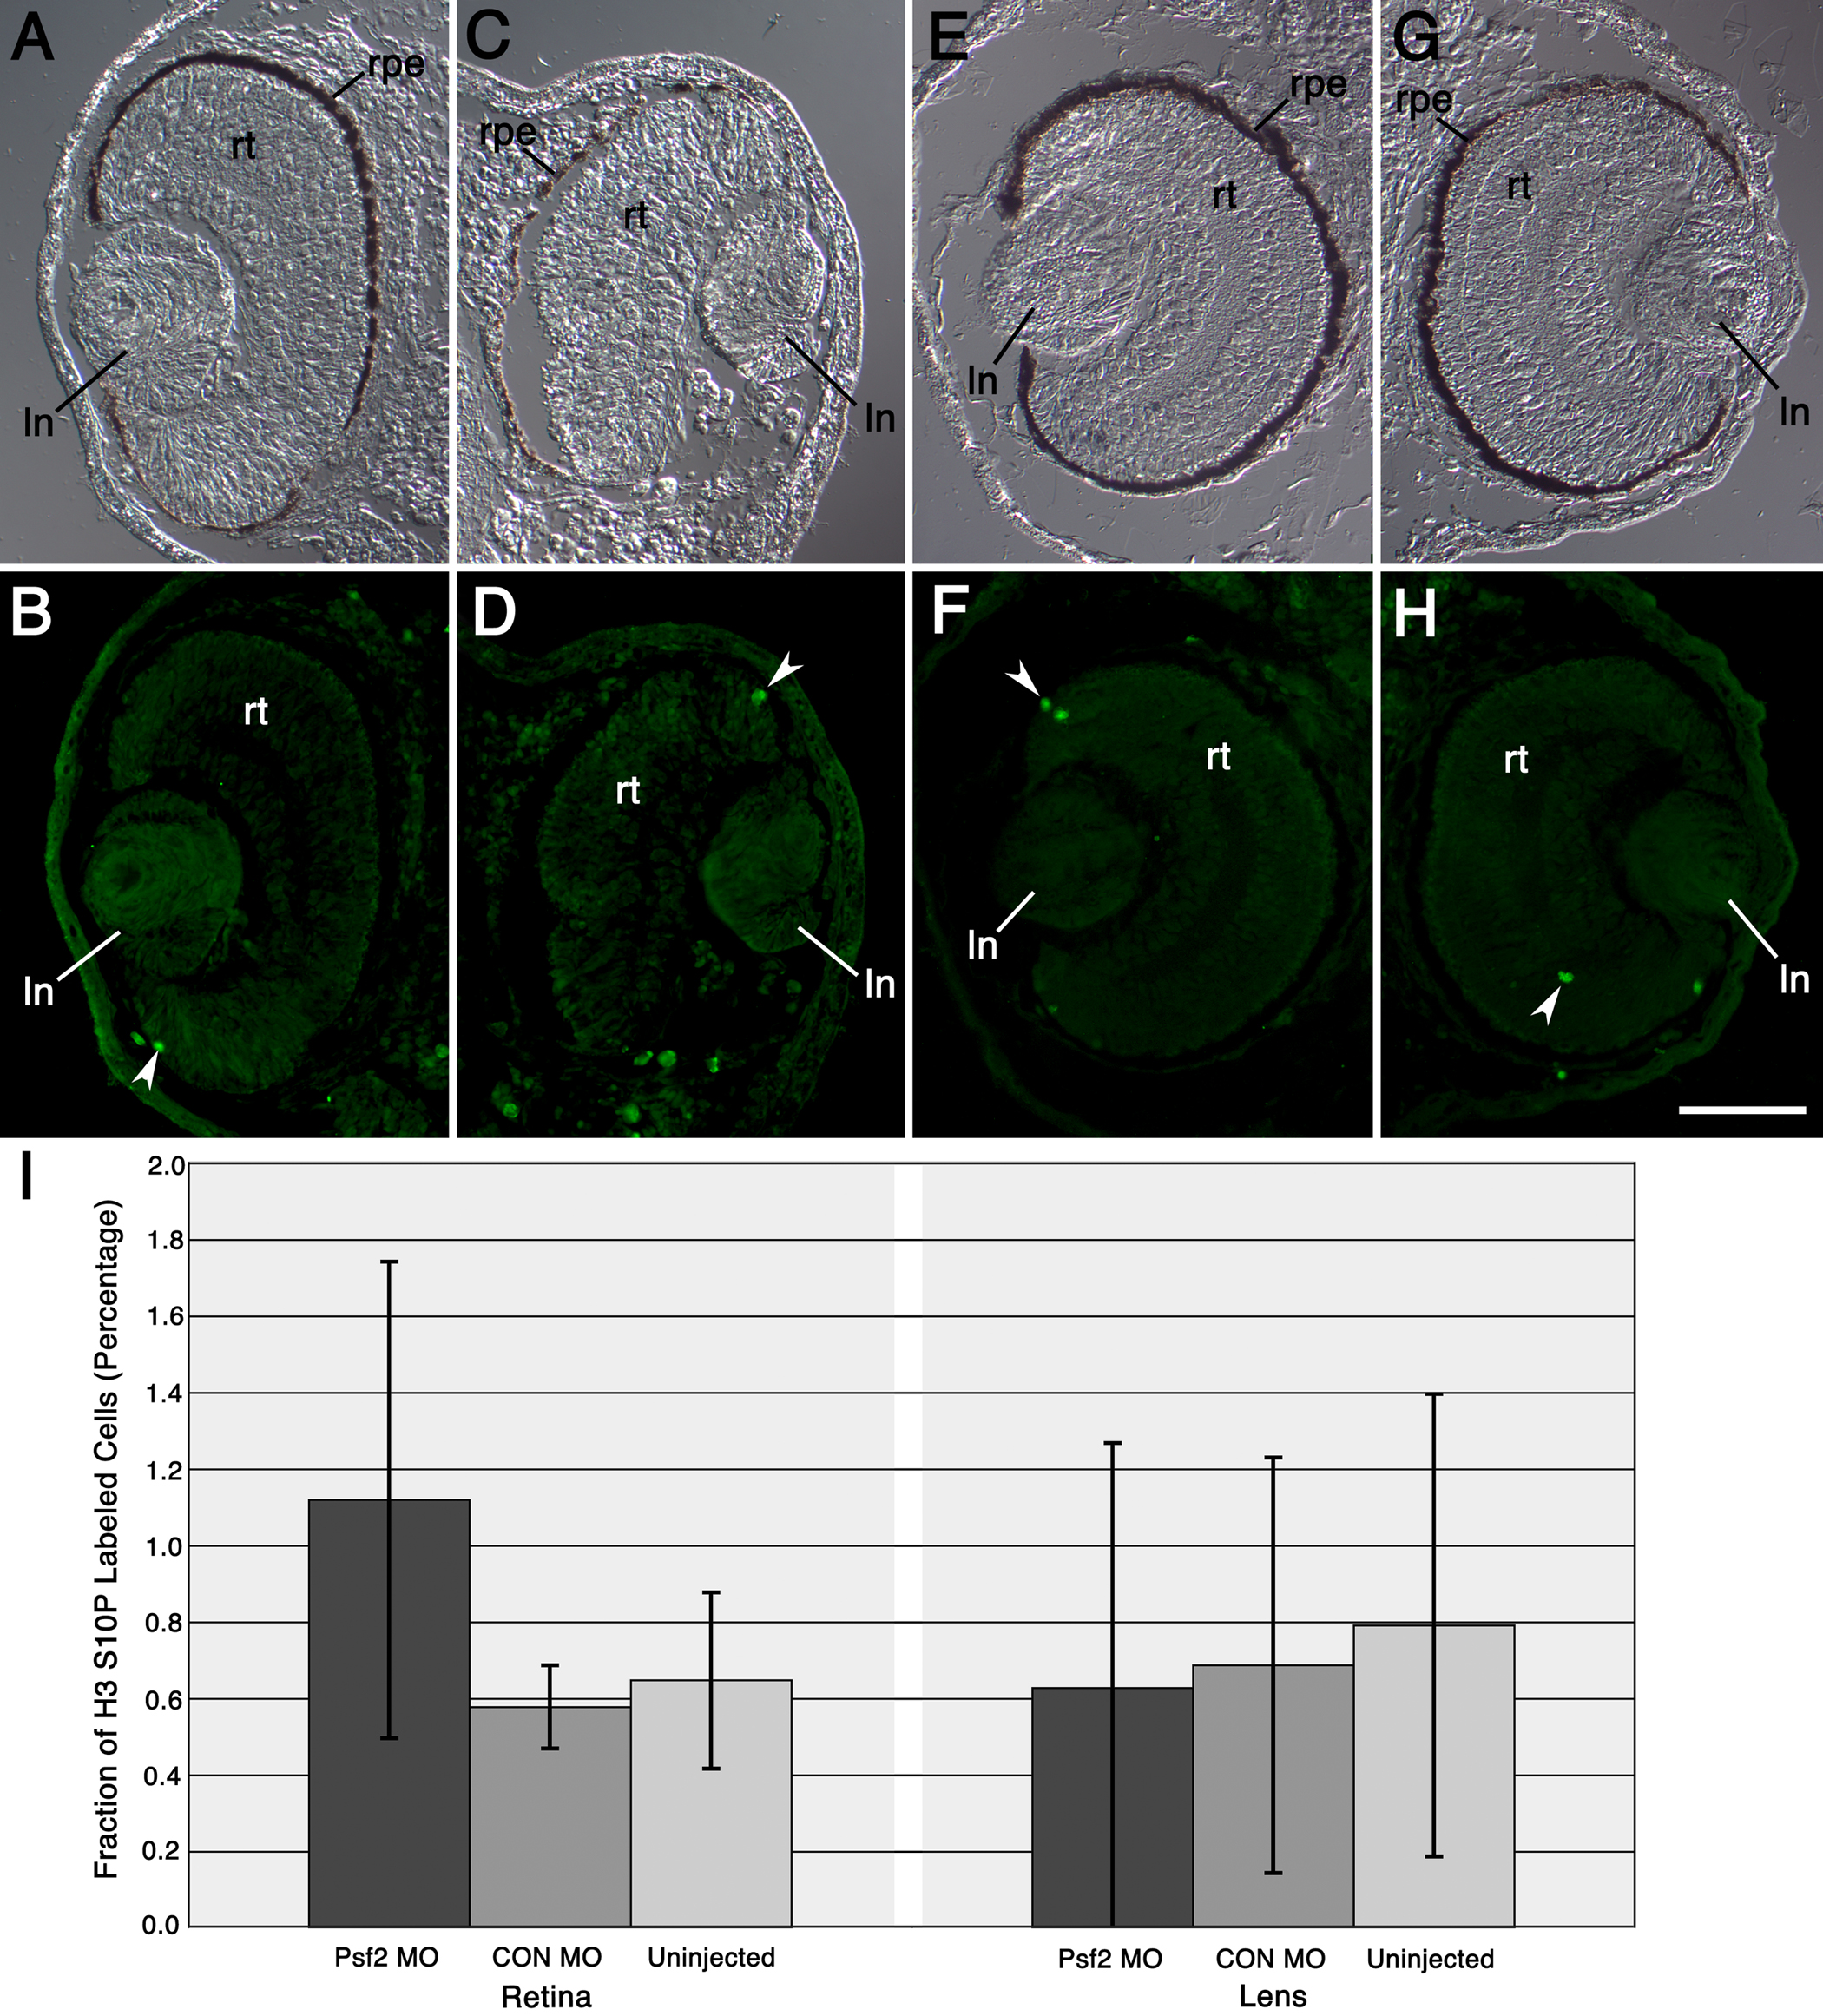
Figure 8. Effects of Psf2MO and CONMO
injections on cell proliferation in the neural retina and lens.
A-
H:
Transverse sections of eyes in Psf2MO-injected and CONMO-injected
embryos show corresponding pairs of differential interference contrast
and fluorescence micrographs. Fluorescence micrographs in
B,
D,
F, and
H show distribution of proliferating cells
labeled with anti-phospho-histone H3 S10P antibody (green). White
arrowheads point to examples of these labeled cells within the retina.
A
and
B: The normal, control eye derived from the uninjected side
of one example is displayed.
C and
D: Opposite,
defective eye derived from the Psf2MO-injected side of the same embryo
shown in
A-
B is displayed in these panels.
E and
F: The normal, control eye derived from the uninjected side of
another embryo is shown.
G and
H: Opposite,
normal-appearing eye derived from the CONMO-injected side of the same
embryo shown in
E-
F is displayed in these panels.
I:
Graphical depiction of the levels of cell proliferation in the neural
retina and the lens is shown. Bars represent the mean fraction of
histone H3 S10P labeled cells (depicted as a percentage along the
y-axis) while the different tissues and conditions examined are
depicted along the x-axis, as indicated. Error bars representing the
standard deviation are also shown. See Methods for further details
explaining the preparation of this data. Labels are the same as those
used in
Figure 4.
Scale bar in
H equals 100 µm.