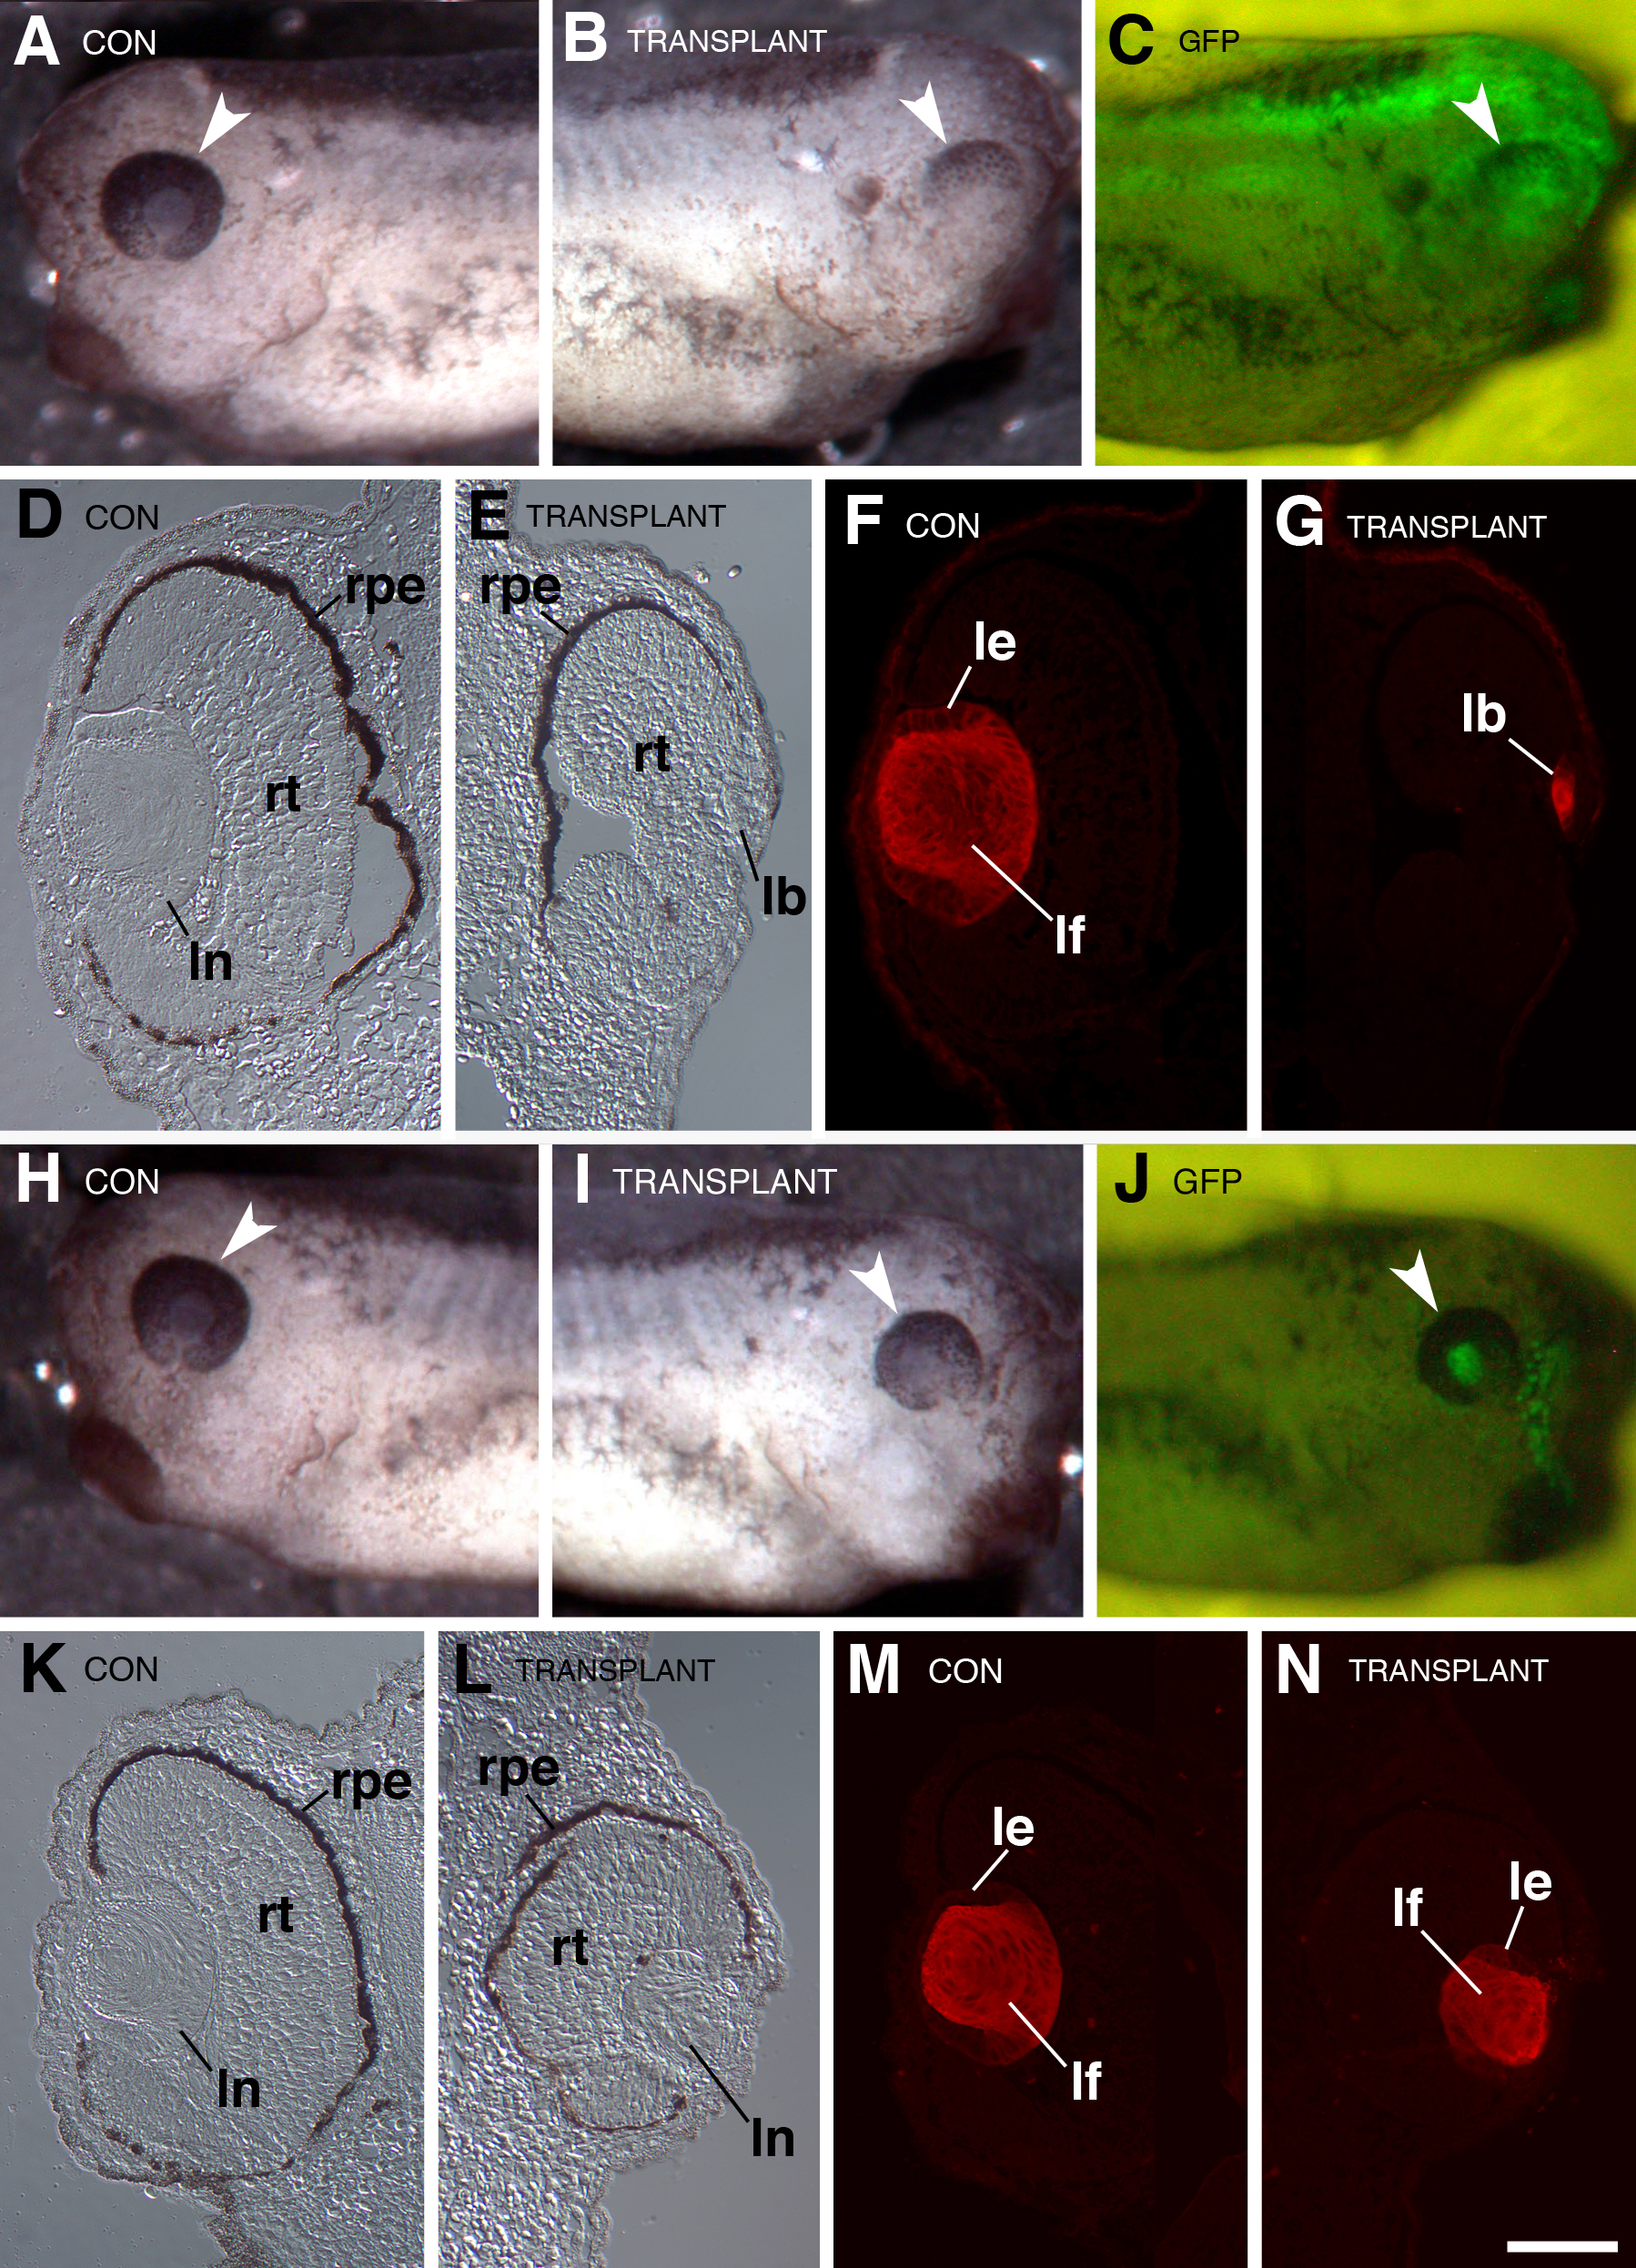
Figure 7. Examples of the results observed
from reciprocal presumptive lens ectoderm transplants between control
and Psf2MO-injected embryos. Dorsal is toward the top in each figure.
Arrowheads point to eyes in the whole mounts shown in
A-
C
and
H-
J.
A-
G: This example shows the
typical result that is observed when the presumptive lens ectoderm from
a control embryo is transplanted to the lens-forming region of a
Psf2MO-injected host (see
Figure 5, the text, and
Figure 6).
A:
The view of the control (“CON”), unoperated side of the larva is shown.
B: The view of the operated side that received the transplanted
PLE (“TRANSPLANT”) shows abnormal development of the retina and lens.
C:
The whole mount fluorescence image corresponds to that shown in
B,
which reveals the location of the transplanted ectoderm via
distribution of GFP expressed in the donor tissue (“GFP”).
D
and
E: High magnification DIC images of transverse sections
through the control side (
D) and the operated side that received
the transplanted tissue (
E) are displayed.
F and
G:
Corresponding immunofluorescence images show anti-lens antibody
staining of the sections shown in
D and
E,
respectively. Note formation of an abnormal retina and small lens body
in
E and
G.
H-
N: This example shows the
typical result that is observed when the presumptive lens ectoderm from
a Psf2MO-injected embryo is transplanted to the lens-forming region of
a control host (see
Figure 5, the text, and
Figure 6).
H:
The view of the control (“CON”), unoperated side of the larva is shown.
I: The view of the operated side that received the transplanted
PLE (“TRANSPLANT”) shows smaller overall size of the eye.
J:
The whole mount fluorescence image corresponds to that shown in
I,
which reveals the location of the transplanted ectoderm via
distribution of GFP expressed in the donor tissue (“GFP”).
K-
I:
High magnification DIC images of transverse sections through the
unoperated, control side (
K), and the side that received the PLE
transplant derived from the Psf2MO-injected embryo (
L), are
shown.
M and
N display the corresponding
immunofluorescence images showing anti-lens antibody staining of the
sections presented in
K and
L, respectively. Note that
the retina and lens formed on the operated side (
L and
N),
although smaller compared to the unoperated side (
K and
M),
exhibit fairly normal morphology. Labels are the same as those used in
Figure 4.
lb stands for lens body. The scale bar in
N is equal to 450 µm
in
A-
C and
H-
J and 80 µm in
D-
G
and
K-
N.