![]() Figure 8 of
Jakobs, Mol Vis 2007;
13:933-948.
Figure 8 of
Jakobs, Mol Vis 2007;
13:933-948.
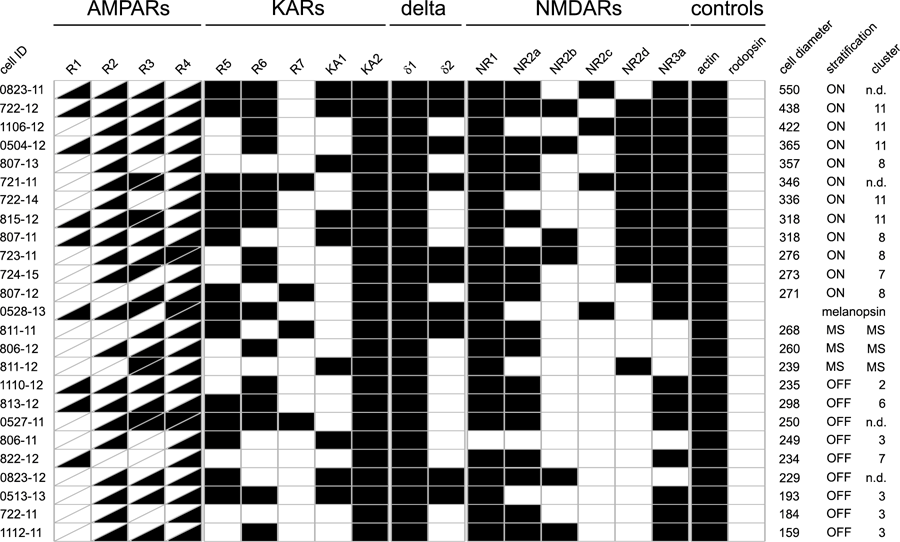
Figure 8. Ionotropic glutamate receptor expression profile in morphologically characterized adult mouse ganglion cells
Cell size, as defined as the largest diameter of the dendritic arbor in mm, stratification ON layer, OFF layer, or multistratified (MS) cells, and cluster designation are also indicated. Some of these cells are shown in Figure 5. n.d. indicates cell could not be traced.
