![]() Figure 3 of
Berta, Mol Vis 2007;
13:881-886.
Figure 3 of
Berta, Mol Vis 2007;
13:881-886.
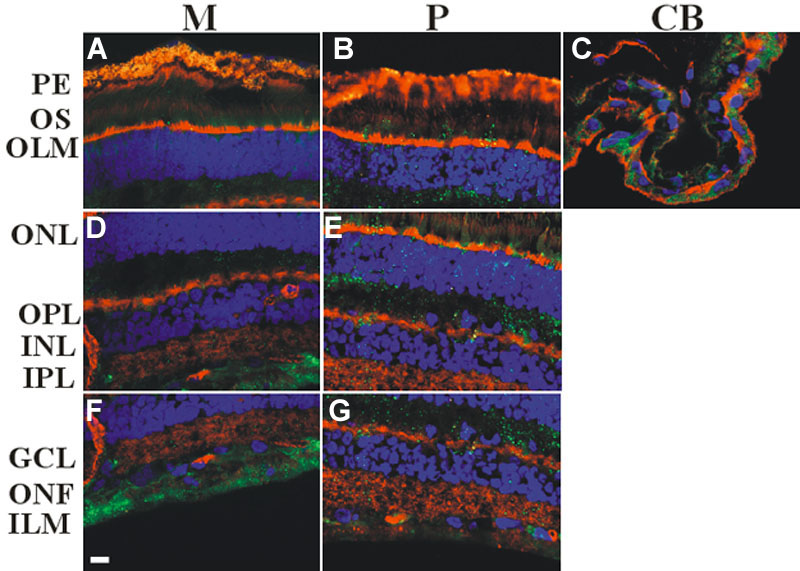
Figure 3. Immunocytochemical analysis of caveolin-3 in the human retina
Samples were taken as described in Figure 1. Alexa Fluor 488 was used to detect caveolin-3 (green). The cytoskeleton and the nuclei were treated with Alexa fluor 594 labeled phalloidin (red) and DAPI (blue), respectively. Presented images are merged. Caveolin-3 was observed in the outer nuclear layer (ONL) and the inner limiting membrane (ILM), including the intervening layers. A, D, and F: show very low, low, and moderate densities (M). B, E, G: At the peripheral part (P) IRs also occurred in the layer of the outer segments (low). C: At the ciliary body (CB), caveolin-3 signals could be seen in both layers (low, moderate). Note, that pigment granules show autofluorescence. Scale bar represents 10 μm. Following abbreviations are used in this figure: outer segments (OS), outer limiting membrane (OLM), outer plexiform layer (OPL), inner nuclear layer (IPL), inner plexiform layer (INL), ganglion cells (GC), optic nerve fibers (ONF).