![]() Figure 1 of
Berta, Mol Vis 2007;
13:881-886.
Figure 1 of
Berta, Mol Vis 2007;
13:881-886.
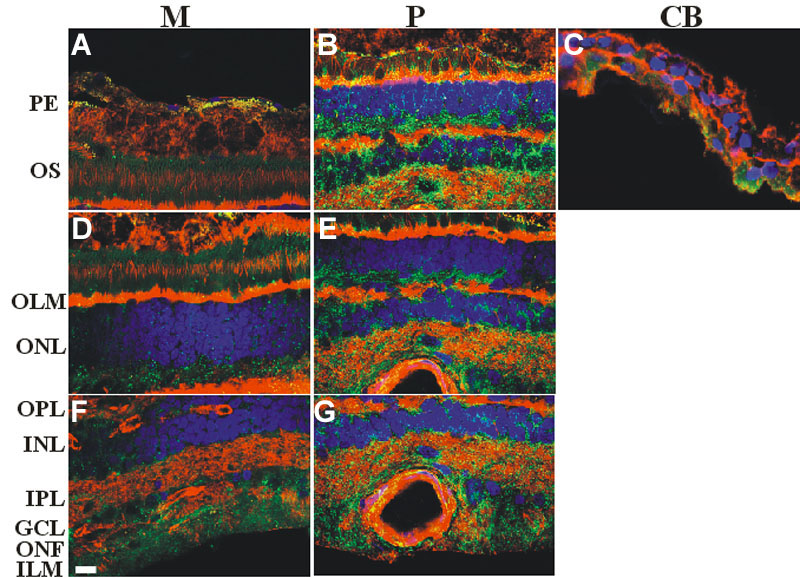
Figure 1. Immunocytochemical analysis of caveolin-1 in the human retina
Samples were taken from different sites the retina following a radial plane from the central to the peripheral retina. A, D, F: Macular region, M. B, E, G: Periphery, P. C: ciliary body, CB. Alexa Fluor 488 was used to detect caveolin-1 (green). The cytoskeleton and the nuclei were treated with Alexa fluor 594 labeled phalloidin (red) and DAPI (blue), respectively. Merged images are presented. Caveolin-1 was present in all layers of the retina. Weakest signals could be seen in the pigment epithelium (low A). The different regions showed a center-to-peripheral gradient; increasing from very low, low, moderate and high density (M, A, D, F), reaching the maximum level (very high; P, B, E, G), then decreasing towards the extreme periphery of the retina (very low, low; CB, C). Pigment granules showed autofluorescence, but they could be distinguished from caveolin signals. Scale bar represents 10 μm. The following abbreviations were used: pigment epithelium (PE), outer segments (OS), outer limiting membrane (OLM), outer nuclear layer (ONL), outer plexiform layer (OPL), inner nuclear layer (IPL), inner plexiform layer (INL), ganglion cells (GC), optic nerve fibers (ONF), inner limiting membrane (ILM).