![]() Figure 4 of
Yaung, Mol Vis 2007;
13:566-577.
Figure 4 of
Yaung, Mol Vis 2007;
13:566-577.
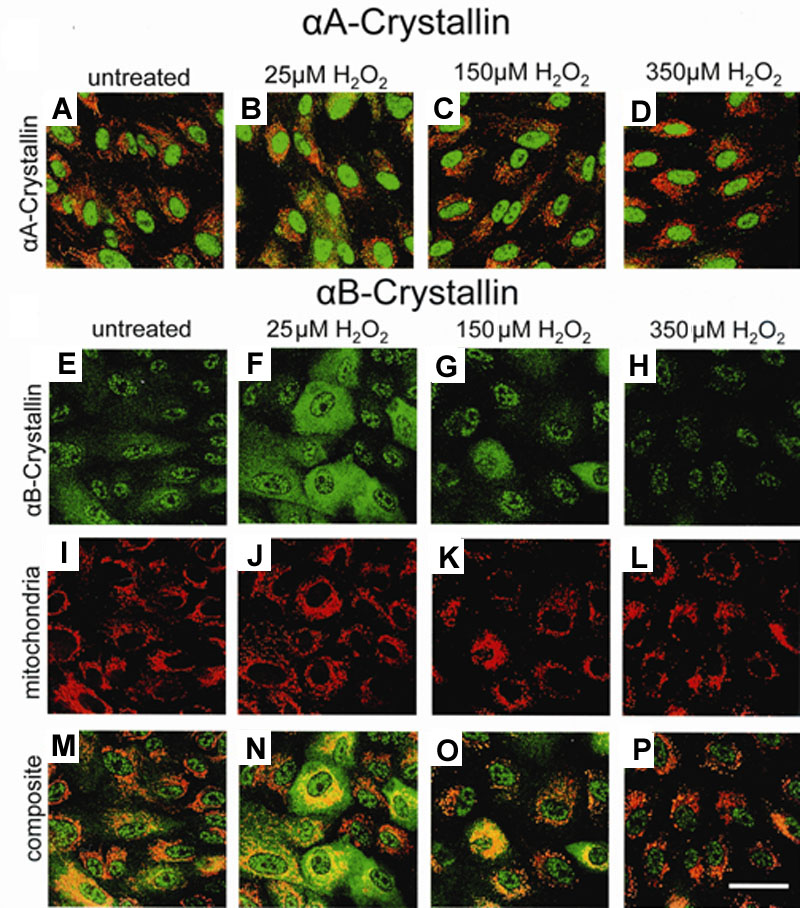
Figure 4. Confocal micrographs of α-crystallin cellular distribution in human retinal pigment epithelium with H2O2 treatment
Retinal pigment epithelium (RPE) grown on 4-well chamber slides were treated with 25 μM, 150 μM, or 350 μM H2O2 for 24 h and stained for either αA (A-D) or αB-crystallin (E-H). Confocal microscopy verified the Western blot analysis for both αA and αB-crystallin shown in Figure 3. Mitochondria tracker allowed visualization of mitochondria in the RPE (A-D and I-L). αA-Crystallin staining, shown as a composite image with mitochondria tracker, revealed little or no change with oxidative treatment (A-D). αB-Crystallin expression was upregulated at low doses of H2O2 as seen by the increase in fluorescent intensity (F). With 150 μM H2O2, αB expression decreased to control levels, but a distinct movement to perinuclear regions of the RPE is observed (G). αB-Crystallin fluorescence further decreased in intensity at 350 μM H2O2 (H). In composite images, the cellular distribution pattern of αB-crystallin was found to show a decrease in mitochondrial localization with the higher levels of oxidative stress (M-P). Bar represents 50 μm. α-Crystallin is green color, Mitochondria is red color, colocalization of α-crystallin, and mitochondria is yellow color.