![]() Figure 4 of
Kumar, Mol Vis 2007;
13:39-46.
Figure 4 of
Kumar, Mol Vis 2007;
13:39-46.
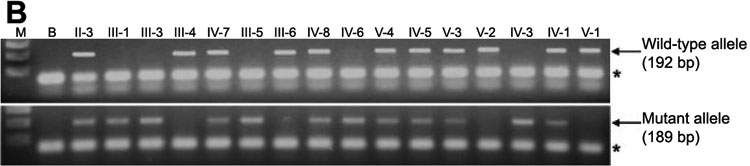
Figure 4. Mutation analysis of the SLC4A11 gene in family 2
A: Sequencing chromatogram of the exon 15 PCR product from the affected individual IV-3. Normal DNA sequence is written on the top of the chromatogram. The tandem repeats of two "TTC" are underlined. Note only one TTC (underlined) in the chromatogram. B: Agarose gel electrophoresis of PCR products from all individuals using wild-type (upper panel) and mutant allele-specific primer sets (lower panel). All normal individuals have bands in the upper panel as expected. All heterozygotes and patients have bands in the lower panel as expected. Lanes M and B stand for 100 bp marker and no template PCR, respectively. Individuals noted on top of the gel pictures are as in Figure 2. An asterisk marks the primer-dimer band.