![]() Figure 1 of
Kamphuis, Mol Vis 2007;
13:220-228.
Figure 1 of
Kamphuis, Mol Vis 2007;
13:220-228.
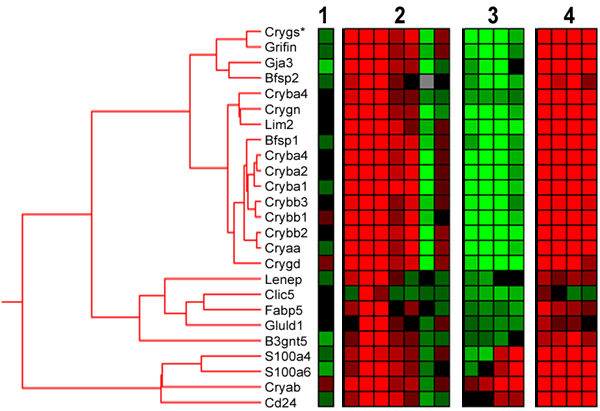
Figure 1. Hierarchical clustering of changes in lens-specific transcripts
Hierarchical clustering of the combined data set: (1) self-self array; (2) IPC; (3) I/R, and (4) IPC-I/R. A total of 25 features, representing 23 different genes, were included in this cluster with a basic node at R2>0.75. Color scale ranges between >2 fold upregulation (red) and >2 fold downregulation (green) compared to corresponding control groups. Gray indicates missing data points. For more details on the genes in the cluster see Table 2.
Note on "Crygs": The annotation for the microarray feature listed as Crygs (XM_573311) may not be correct. A qPCR primer set was designed unique for the rat Crygs with RefSeq (NM_001012016), but the expression levels assessed did not show a correlation with the other cluster members and the lens/retina ratio was 0.09, showing a greater abundance in the retina. These qPCR results for Crygs are not in line with our hypothesis. Blast analysis performed for the 60-mer Crygs probe sequence on the array confirmed a match with XM_573311 in the 3'-UTR and also with Crygs of mouse and human but not with RefSeq NM_001012016. It may that the probe in fact recognizes other members of the Cryg family. qPCR assays were developed for rat Cryga, Crygb, and Crygc. The comparison of the lens and retinal transcript levels resulted in a lens-to-retina ratio of 73, 3273, and 106138, respectively. Expression levels showed a close correlation with the other cluster members. The conclusion is that the Crygs probe on the array is most likely not specific for Crygs but interrogates Cryga, Crygb, and/or Crygc.
