![]() Table 2 of
Kamphuis, Mol Vis 2007;
13:220-228.
Table 2 of
Kamphuis, Mol Vis 2007;
13:220-228.
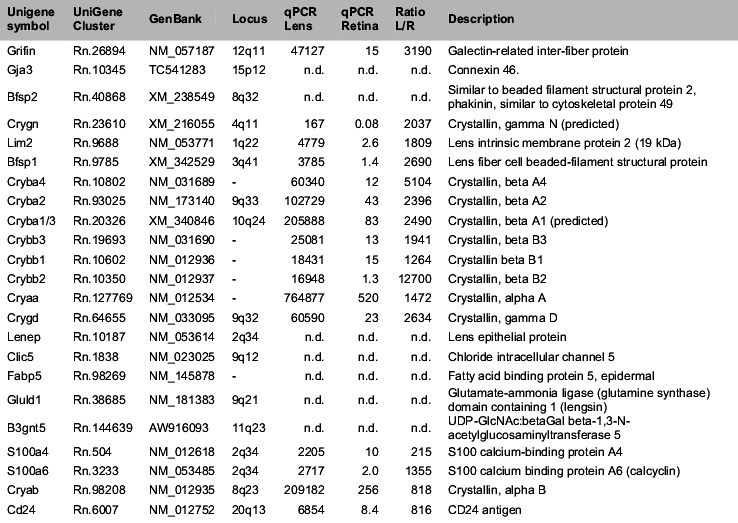
Table 2. Symbol and accession number information on genes of the cluster given in figure 1
Transcript levels in lens and retina are determined by qPCR and are presented in arbitrary units. n.d. represents not determined by qPCR.
