![]() Figure 6 of
Hanna, Mol Vis 2007;
13:2194-2208.
Figure 6 of
Hanna, Mol Vis 2007;
13:2194-2208.
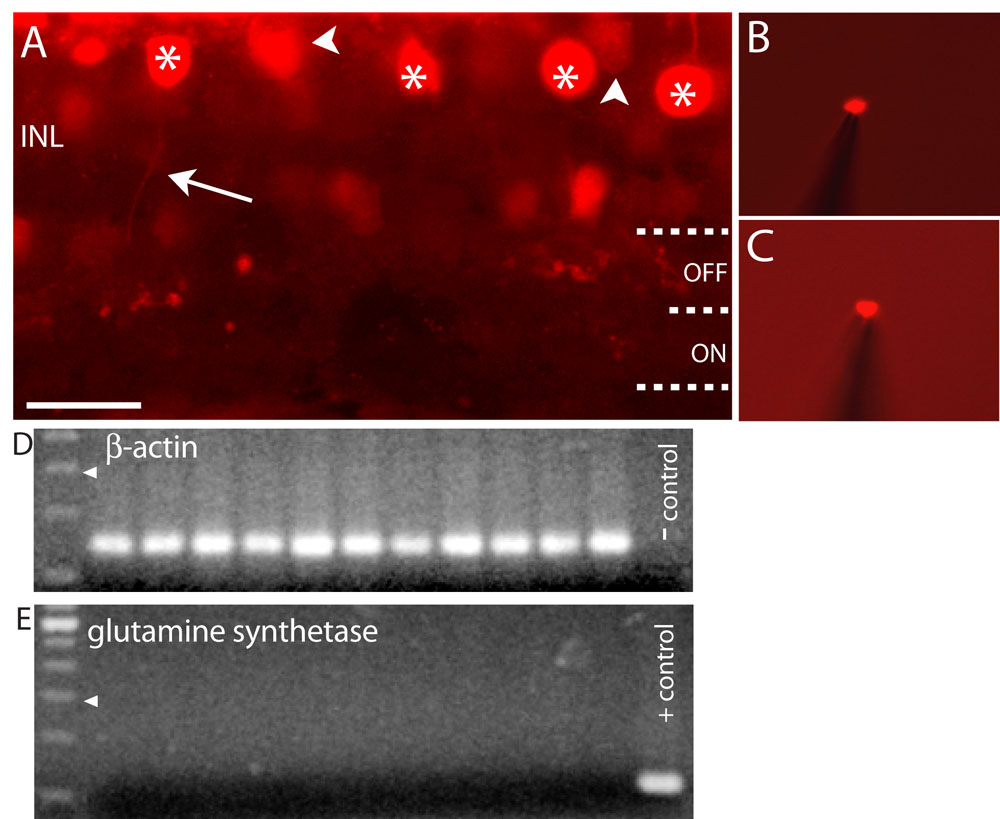
Figure 6. Labeling and extraction of DB3 cells and controls
A: High-magnification fluorescent image shows a vertical slice of macaque retina immuno-labeled with anti-calbindin-28 kDa. In this focal plane, labeled horizontal cells (arrowheads) appear in the background above the more prominent DB3 bipolar cells (asterisks). A DB3 axon (arrow) is shown descending from the inner nuclear layer (INL) deep into the OFF sublamina just above the border with the ON sublamina of the inner plexiform layer (IPL) [40]. The ganglion cell and photoreceptor layers are out of the image, while the shadow of the patch pipette electrode is apparent in the bottom middle of the image. Some amacrine cells deep in the INL may be weakly labeled. These we avoided by targeting only cells just below the horizontal cell layer. B, C: Two representative single cells labeled for calbindin were harvested from the slice with a patch electrode. Identification was based on the clear presence of a descending axon. The retinal slice is no longer visible as it lies out of the plane of focus. Scale bar represents 10 μm. D: Expected PCR product for β-actin in cDNA from each of 11 representative DB3 cells is shown negative control without reverse transcriptase for DB3 cell is lacking product, as expected. E: The same DB3 cells tested negative for expression of glutamine synthetase, which is expressed by Müller glia. Positive control was obtained using cDNA from fixed slice, as shown in Figure 1.