![]() Figure 2 of
Augusteyn, Mol Vis 2007;
13:2030-2034.
Figure 2 of
Augusteyn, Mol Vis 2007;
13:2030-2034.
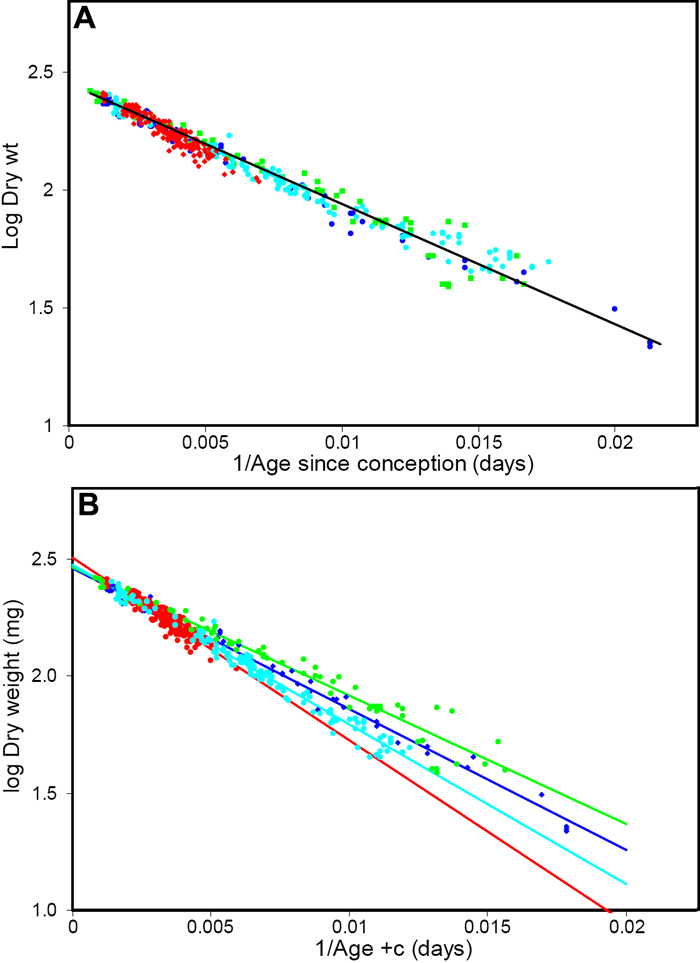
Figure 2. Logistic analysis of rabbit lens growth data
(A) Reanalysis using c=32 of the data for all 450 European rabbit lenses shown in Figure 1A. The colors represent the same studies as described in Figure 1. The line of best fit, obtained from linear regression analysis of the combined data using c=32, is included. This analysis yielded the relationship log (Dry weight) = log (276) - 51.7/(A+32) and (B) the logistic plots of the same data as shown in Figure 2A but interpreted according to the original authors. The lines of best fit, which are included in the figure, yield the constants listed in Table 1.
