![]() Table 1 of
Mott, Mol Vis 2007;
13:1802-1812.
Table 1 of
Mott, Mol Vis 2007;
13:1802-1812.
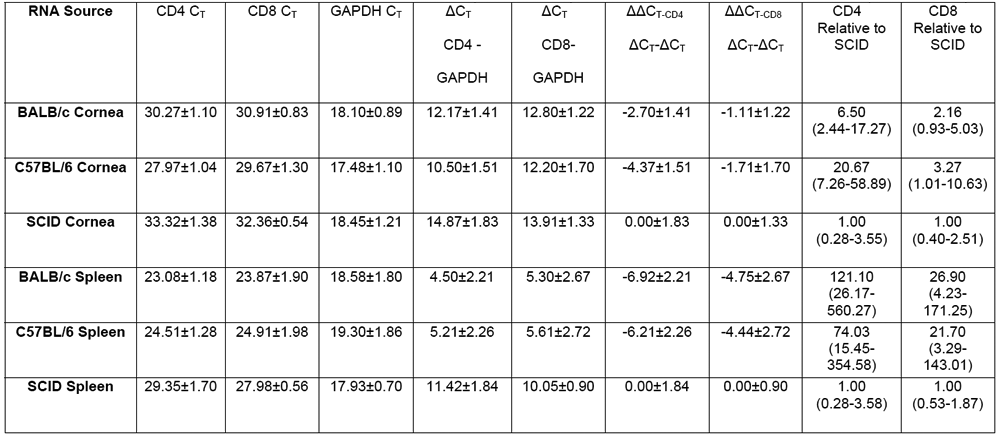
Table 1. Relative quantitation of CD4 and CD8 mRNA transcript expression in cornea and spleen using the comparative CT method
A: Quantitative RT-PCR was performed in triplicate using 2 μl of cDNA reverse transcribed from 500 μg of total RNA from individual cornea or spleen samples (four mice for BALB/c and C57BL/6 groups and two mice for SCID group). The mean threshold cycle (CT) value for each target (CD4 and CD8) and endogenous reference (GAPDH), representing the PCR cycle at which the ABI 7900 HT Detection System first detects a noticeable increase in reporter florescence above baseline signal, was calculated for each group. B: The δCT values for each target were determined by subtracting the mean GAPDH CT value from the mean CD4 and CD8 CT values. The standard deviation of the difference was calculated from the standard deviations of the CD4, CD8, and GAPDH values by the formula (s= the square root of s12 + s22). C: In this study the SCID animal group was chosen as the arbitrary constant and all expression levels are presented as relative to the SCID group. The calculation of δδCT involved subtraction of the δCT of the SCID sample from the δCT of the compared BALB/c and C57BL/6 samples. The standard deviation is equivalent to the standard deviation of the δCT. D: The range of CD4 and CD8 fold expression relative to the SCID cornea and spleen was determined by the expression: 2-δδCT± the standard deviation as shown in Figure 4.