![]() Figure 5 of
Zhang, Mol Vis 2006;
12:821-831.
Figure 5 of
Zhang, Mol Vis 2006;
12:821-831.
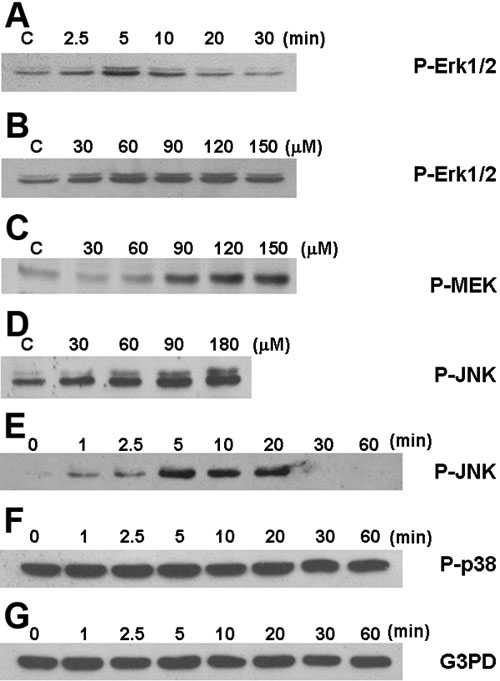
Figure 5.
AA-stimulated activation of MAPK pathways in HLE B3 cells. Cells (1.6 million) were serum starved and stimulated with AA as described in Figure 4A. The cell lysate was used for western blot analysis for the presence of activated or phosphorylated MEK (P-MEK), ERK1/2 (P-ERK), JNK (P-JNK), p38 (P-p38) using respective anti P-MAPK antibodies. G3PD was probed with anti-G3PD antibody for internal control. The experiments were carried out at least two times for each of the following conditions. A: Time-dependent ERK1/2 activation. The cells were stimulated with 60 μM AA for 0 (control), 2.5, 5, 10, 20, and 30 min. B: Dose-dependent ERK1/2 activation. The cells were stimulated for 10 min by AA at concentrations of 0 (control), 30, 60, 90, 120, and 150 μM. C: Activation of MEK. The cells were stimulated with 60 μM AA for 0 (control), 2.5, 5, 10, 20, and 30 min. D: Dose-dependent JNK activation (P-JNK). Cells were stimulated by AA for 10 min at 0 (control), 30, 60, 90, and 180 μM. E: Time-dependent JNK activation. The cells were stimulated with 60 μM AA for 0 (control), 2.5, 5, 10, 20, and 30 min. F: Western blot analysis of P-p38 using the same samples in Panel B. G: Western blot analysis of G3PD using the same samples in Panel B.