![]() Figure 3 of
Lopez-Garrido, Mol Vis 2006;
12:748-755.
Figure 3 of
Lopez-Garrido, Mol Vis 2006;
12:748-755.
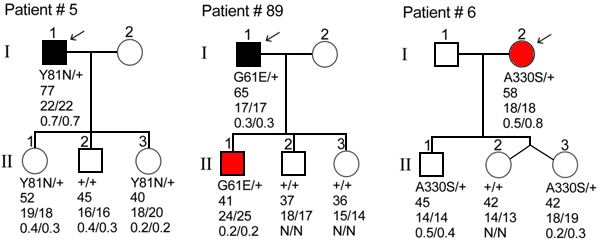
Figure 3.
Pedigrees of two cases diagnosed with POAG and 1 case diagnosed with OHT. The genotypes, ages (years) at the time of the study, IOP (mmHg OD/OS), and C/D ratios (OD/OS) are indicated below the symbols. The arrows show the probands. Black and red symbols indicate POAG and OHT phenotypes, respectively.
