![]() Figure 2 of
Robinson, Mol Vis 2006;
12:704-711.
Figure 2 of
Robinson, Mol Vis 2006;
12:704-711.
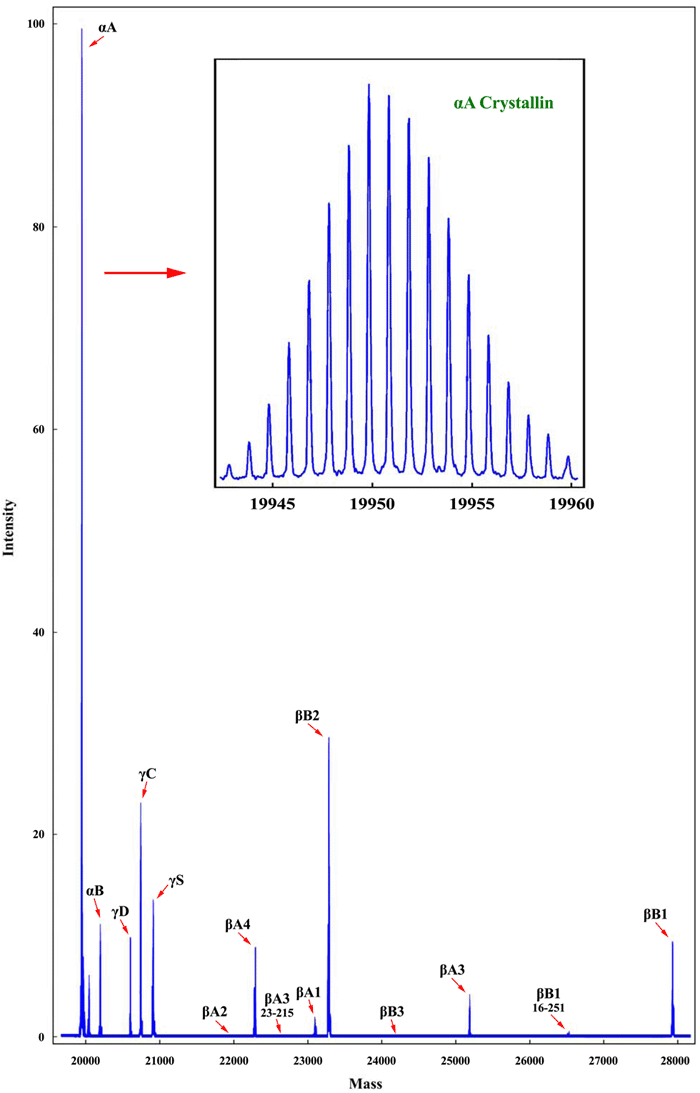
Figure 2.
Mass spectrum of a 2-day-old crystallin sample. This spectrum was constructed by multiplication of each protein species by its charge. Thus, the mass/charge output of the mass spectrometer is deconvoluted into a simple mass spectrum. Compression of the mass axis between 20,000 and 30,000 mass units gives the appearance of single modal peaks. Expansion of the scale, as illustrated for αA-crystallin in the inset, shows the fine structure of the actual spectra. The superb resolution of the FTMS method when applied to unfractionated lens homogenates is demonstrated by this total mass spectrum. Integration of the peaks in this spectrum gives the values that are, after concentration normalization, listed in Table 1. Small amounts of various post-synthetically modified crystallins are also observed in this spectrum. For example, oxidized, phosphorylated, and oxidized and phosphorylated αA-crystallins are observed at masses 18, 80, and 98 Da higher than αA-crystallin itself.
