![]() Figure 3 of
Vanita, Mol Vis 2006;
12:518-522.
Figure 3 of
Vanita, Mol Vis 2006;
12:518-522.
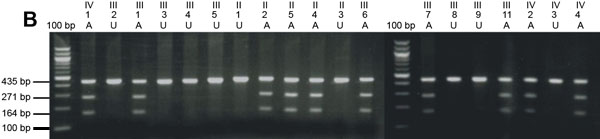
Figure 3.
DNA sequence and restriction endonuclease analysis of CRYAA in an affected individual. A: Electropherogram showing a part of CRYAA sequence (forward strand) of an affected member (IV-1; Figure 1). A heterozygous C>T substitution at the first base of codon 116 (CGC-TGC), resulting in substitution of arginine-116 by cysteine (R116C) in the affected individual's sequence is indicated by an arrow. B: Restriction endonuclease analysis shows creation of a novel restriction enzyme site for BtsI because of the C>T substitution in codon 116 of CRYAA. Affected individuals (marked A and with numbers at top as given in pedigree; Figure 1) show three bands following restriction digestion with BtsI (164 bp, 271 bp, and an undigested band of 435 bp) on 2.2% agarose gel. All the unaffected members (marked as U and with individual numbers at top) show only a single undigested band of 435 bp. The first and forteenth lanes show a 100 bp molecular weight marker.