![]() Figure 1 of
Makarev, Mol Vis 2006;
12:1386-1391.
Figure 1 of
Makarev, Mol Vis 2006;
12:1386-1391.
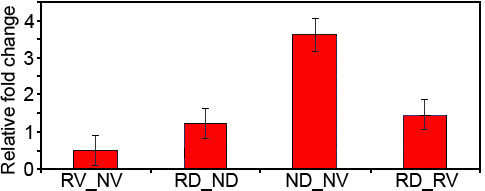
Figure 1.
Expression of miR-124a during lens regeneration examined via QPCR and shown as fold change. Comparisons include the normal dorsal (intact) iris (ND), the normal (intact) ventral iris (NV), and dorsal (RD) and ventral (RV) irises isolated during regeneration, at 8 days post lentectomy. Value 1 means no change (equal levels of expression). Thus, we can see from the figure that the intact dorsal iris shows a nearly 4 fold increase versus the intact ventral iris. Each sample was run in triplicate; mean±SE. Data analysis was performed using the Pfaffl method [18]. The coefficients of efficiency of amplification were determined from kinetic curves [19].
