![]() Figure 3 of
Pelzel, Mol Vis 2006;
12:1272-1282.
Figure 3 of
Pelzel, Mol Vis 2006;
12:1272-1282.
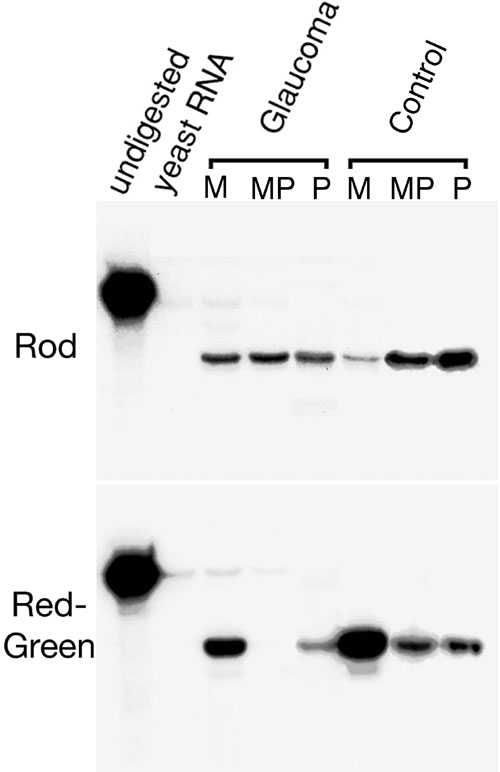
Figure 3. RNase protection assays of opsin mRNAs
Shown are levels of protected fragments for both rod opsin (top panel) and red/green cone opsin (lower panel) in three regions of the control and glaucomatous retinas of this individual. The level of mRNA rod appears low in this experiment because less input total RNA was used for this reaction (this level is corrected for loading when the radioactivity in the protected fragment is quantified). In the glaucomatous retina, the red/green cone levels dramatically decrease in both the macula (M) and mid-periphery (MP), but less so in the peripheral retina (P). Quantification of these results is shown in Table 3.