![]() Figure 6 of
Ranjan, Mol Vis 2006;
12:1077-1085.
Figure 6 of
Ranjan, Mol Vis 2006;
12:1077-1085.
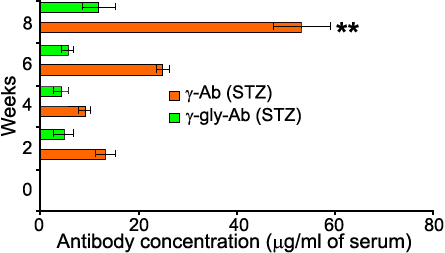
Figure 6.
Profile of circulating autoantibodies in rat serum to γ- and γ-glycated-crystallins as determined by antibody capture assay during the experimental period. Autoantibodies were not detected in control groups throughout the experimental duration. Values are mean±SD at every given time (n=5). The double asterisk indicates a p<0.001 for γ-crystallin autoantibodies between weeks two and eight.
