![]() Figure 2 of
Ranjan, Mol Vis 2006;
12:1077-1085.
Figure 2 of
Ranjan, Mol Vis 2006;
12:1077-1085.
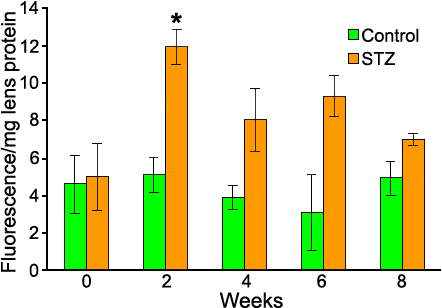
Figure 2.
advanced glycation end product-like flurophores in the total lens homogenate as a function of cataract progression in diabetic rats (λex 366 nm; λem 440 nm). Values are mean±SD (n=5). The asterisk indicates a p<0.001 when compared with the zero week value.