![]() Figure 9 of
Byun, Mol Vis 2006;
12:949-960.
Figure 9 of
Byun, Mol Vis 2006;
12:949-960.
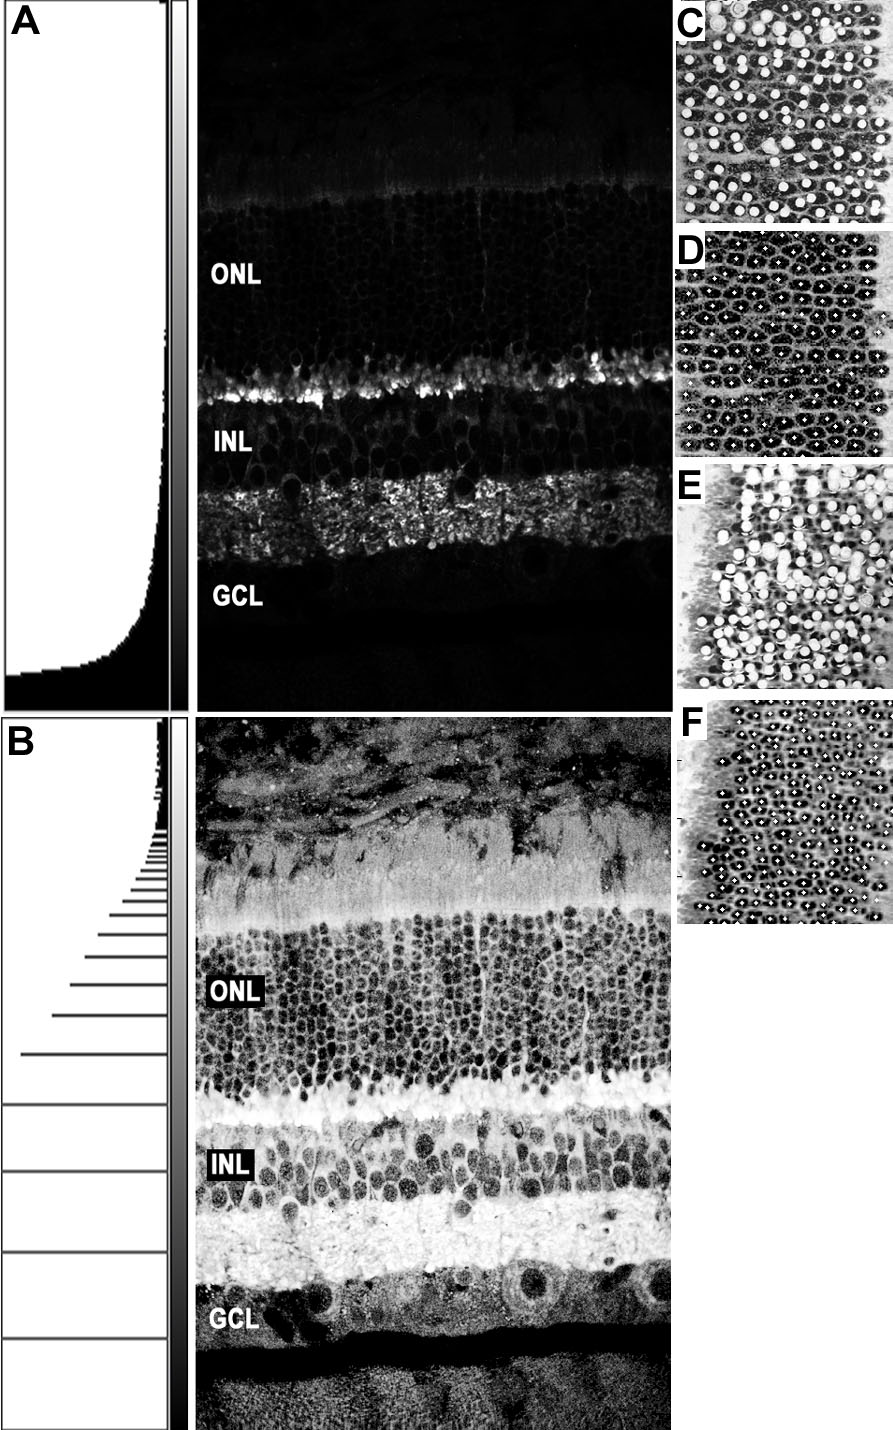
Figure 9. Application to images stained with various antibodies
A: Example of a single labeled image of synaptic terminals (anti-synaptophysin). The staining did not provide any contrast to nuclei. B: Histogram equalized image shows a full range of black to white values. C,D: Histogram equalized images of the retina labeled with anti-vimentin. E,F: Histogram equalized images of the retina single labeled with anti-neurofilament. A comparison of images manually counted and counted with the nucleus detector are shown. C,E: Manually counted images. The nuclei were counted on the printed paper by placing dots over the nuclei. The paper was scanned to create a digital image. D,F: Nucleus detector. White dots on the image represent detected nuclei.