![]() Figure 6 of
Byun, Mol Vis 2006;
12:949-960.
Figure 6 of
Byun, Mol Vis 2006;
12:949-960.
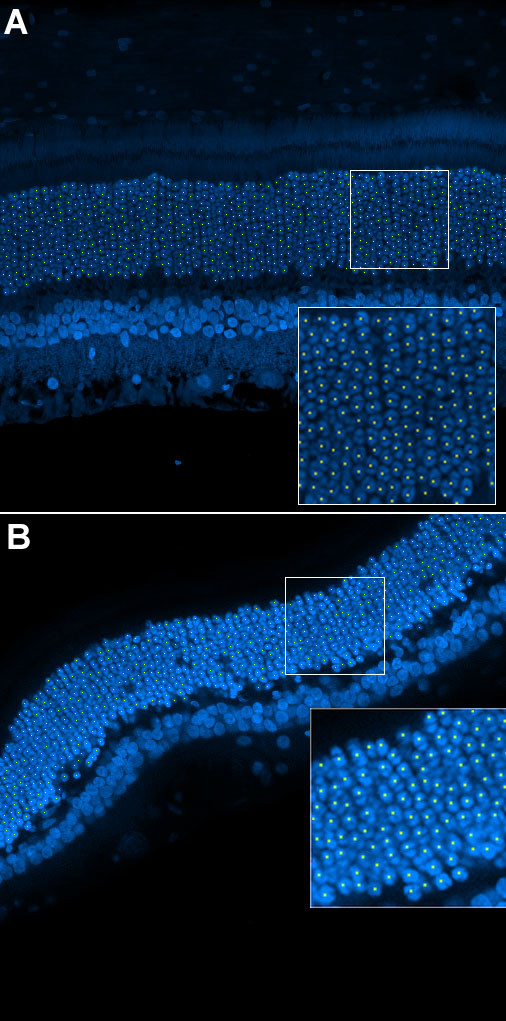
Figure 6. Application of the nuclei detector to retinal images
A: Confocal image of a normal cat retina stained by TO-PRO. Detected cell centers are marked with yellow points. 688 cells are detected with 0.5% error compared with manual counts (690 cells). B: Applying the nucleus detector to diagonally oriented confocal image of a 3-day detached cat retina stained by TO-PRO. The image was acquired with poor contrast. Detected cell centers are marked with yellow points. 606 cells are detected with 3.5% error compared with manual counts (628 cells).