![]() Figure 5 of
Byun, Mol Vis 2006;
12:949-960.
Figure 5 of
Byun, Mol Vis 2006;
12:949-960.
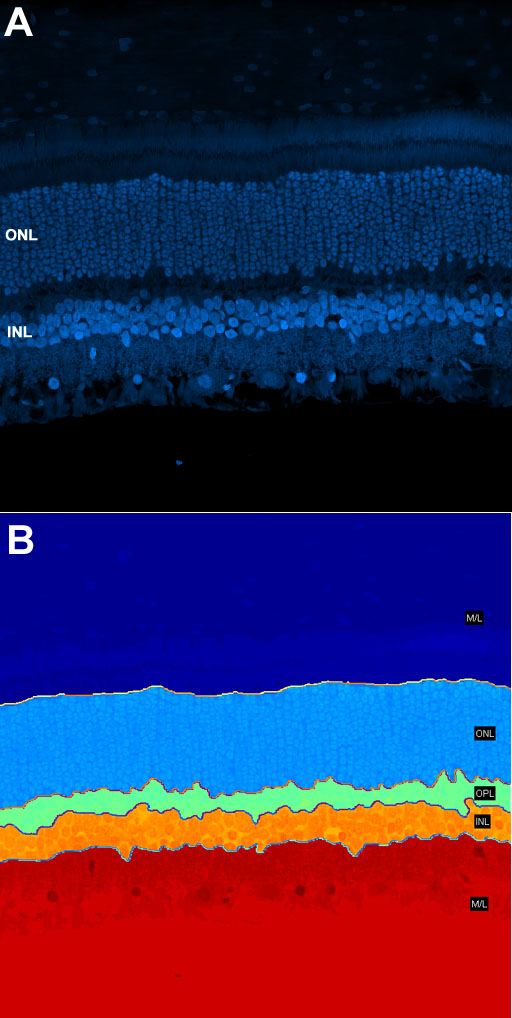
Figure 5. Example image of a layer map, a schematic representation of the retinal layers, created from a retinal image
A: Confocal image of a normal cat retina stained by TO-PRO. B: Layer map of Panel A. Boundaries of layers are outlined manually.