![]() Figure 4 of
Byun, Mol Vis 2006;
12:949-960.
Figure 4 of
Byun, Mol Vis 2006;
12:949-960.
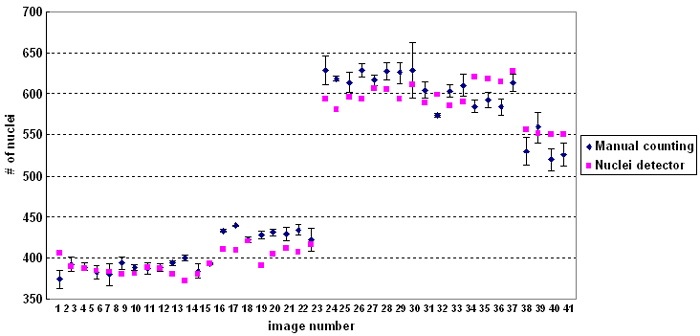
Figure 4. A summary of test results of 41 images
Blue dots denote manual counting and the error bar of each blue dot indicates intra-observer variation: standard deviation of three manual counting results of each image. Pink dots represent the result of the automated nuclei detector. The nuclei detector does not systematically overestimate or underestimate the number of nuclei compared to the manual counts.
