![]() Figure 3 of
Byun, Mol Vis 2006;
12:949-960.
Figure 3 of
Byun, Mol Vis 2006;
12:949-960.
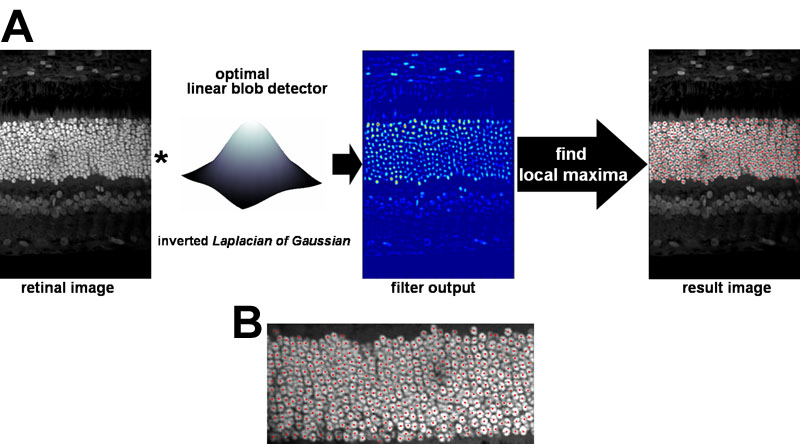
Figure 3. Nuclei detector design
A: Schematic diagram of the nuclei detector: the blob centers are detected by filtering with the blob detector followed by searching local maxima. B: Higher magnification of the outer nuclear layer within the result image in Panel A.