![]() Figure 2 of
Byun, Mol Vis 2006;
12:949-960.
Figure 2 of
Byun, Mol Vis 2006;
12:949-960.
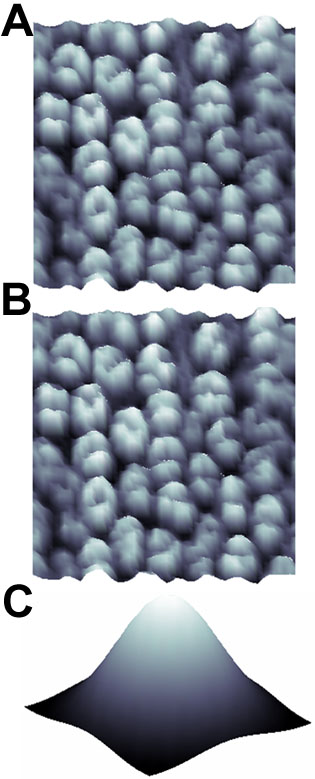
Figure 2. Nucleus as a blob
A: Example image of the outer nuclear layer within a feline retina stained by TO-PRO. TO-PRO stains double stranded nucleic acid in nuclei, which appears much brighter in certain parts of the cell. Such intensity variation is associated with the DNA distribution within these cells. B: 3-D surface plot of Panel A: the height of each point on the 3-D surface corresponds to the intensity of each pixel in the image. Each nucleus is represented by multiple peaks caused by variation of DNA distribution within a cell, however, it can be modeled as a uni-modal intensity distribution shown in Panel C. The model is used as a template to detect nuclei in an image.