![]() Figure 4 of
Zhang, Mol Vis 2006;
12:937-948.
Figure 4 of
Zhang, Mol Vis 2006;
12:937-948.
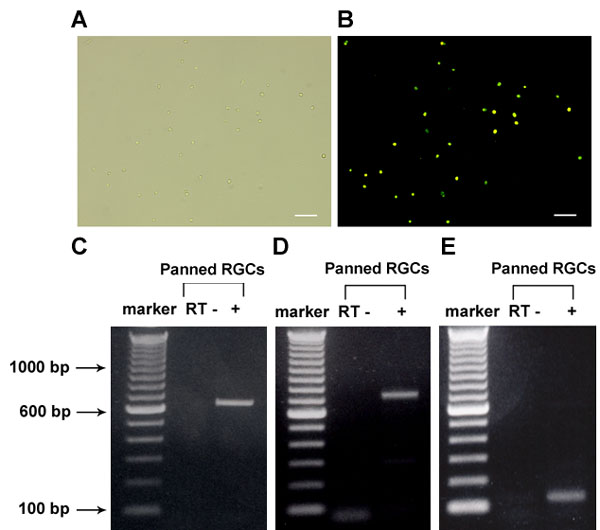
Figure 4. Gene expression of A3 adenosine receptor in the retinal ganglion cells harvested by immunopanning
A,B: Retinal ganglion cells images taken 1 h after immunopanning. Panel A shows a brightfield image, while Panel B shows the same cells observed under fluorescent light. All cells present in the field are fluorescent, indicating the high purity of the harvest (bars represent 100 μm). C-E: The expression of the A3 receptor mRNA in isolated ganglion cells detected with conventional RT-PCR. C: The 641 bp product of primer pair A3U. D: The 724 bp PCR product from primer pair A3L. E: The 123 bp PCR product of pair A3Q. F: The expression of the A3 receptor mRNA in purified ganglion cells using real-time RT-PCR, as described for Figure 3D. Similar results were found with cDNA obtained from 5 separate isolations.