![]() Figure 3 of
Zhang, Mol Vis 2006;
12:937-948.
Figure 3 of
Zhang, Mol Vis 2006;
12:937-948.
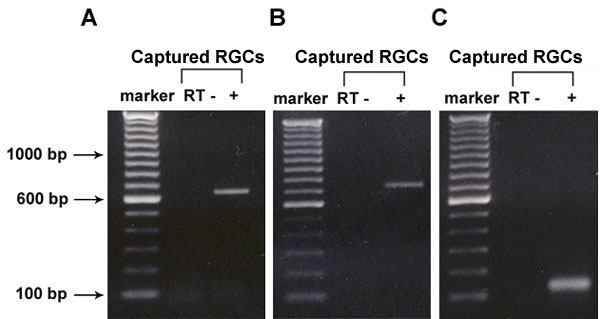
Figure 3. Gene expression of A3 adenosine receptor in captured cells from the ganglion cell layer
Expression of A3 adenosine receptor mRNA was detected from material obtained from labeled cells in the ganglion cell layer. Panels A-C shows results from traditional PCR run on 1% agarose gels. A: The 641 bp PCR product of the 5' end of the encoding sequence from primer pair A3U is shown. B: The 724 bp PCR product of the 3' portion from primer pair A3L. C: The 123 bp PCR product of the cDNA of A3 adenosine receptor using the primers for real-time PCR. The left lanes correspond to PCR marker; size of the DNA fragments is indicated on the left. Negative controls, obtained by omitting the reverse transcriptase, are indicated by "RT-". D: A typical result from real-time PCR analysis using primers for the GAPDH and A3 receptor genes. The abscissa indicates the number of PCR cycles and the ordinate shows the fluorescence emitted by SYBR green dye-labeled PCR products. The curves on the left represent the PCR product of GAPDH and the curves on the right represent the PCR products of A3 adenosine receptor. Each reaction has been performed here in triplicate. Similar results were found with RNA from 5 different microdissections.