![]() Figure 5 of
Mader, Mol Vis 2006;
12:915-930.
Figure 5 of
Mader, Mol Vis 2006;
12:915-930.
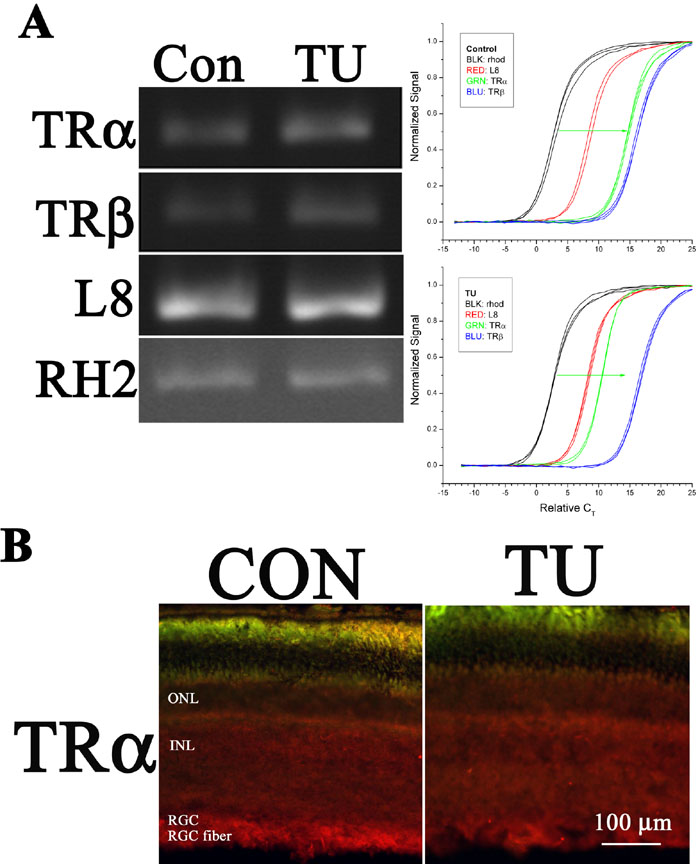
Figure 5. Gene expression and protein presence in normal and hypothyroidic retina
A: RT- and qPCR analysis of selected retinal gene expression for control and TU-exposed fish. Left, Gel electrophoresis analysis of RT-PCR-amplified, partial-length products encoding TRα, TRβ, L8, and RH1 (rhodopsin) from control and TU-exposed retinas. The analyzed retinal cDNA was collected from the same set of animals that provided material for the western blot analysis (Figure 3A). Note the lack of overt difference in the amount of mRNA encoding TRβ, L8, or RH1 across the control and TU-exposed conditions, and a suggestion of TU-dependent elevation in the TRα message. Right, Normalized real-time PCR growth curves, scaled with respect to the mean CT value for RH1 (rhodopsin; black curves) [43]. The relative difference between RH1 and TRα (green arrow) is less in the TU condition compared to control, consistent with a TU-dependent (i.e., hypothyroid-induced) elevation in the TRα message, whereas the other products' growth curves, such as those for TRβ, are independent of experimental condition. B: Qualitative effects of TU exposure upon TRα protein distribution in the retina. Indirect immunohistochemical labeling for TRα in control (Con) and TU-exposed postmetamorphic retina (Cy3 label; cf. Figure 3B). The apparent "green" signal in Panel B is tissue auto-fluorescence. Cy3 label is evident at the RGC fiber layer and the proximal outer plexiform layer (arrow). Although TU exposure leads to an up-regulation of TRα mRNA (Panel A) no overt, TU-dependent changes in the distribution or level of TRα protein are evident, consistent with western blot analysis (Figure 3A).