![]() Figure 3 of
Mader, Mol Vis 2006;
12:915-930.
Figure 3 of
Mader, Mol Vis 2006;
12:915-930.
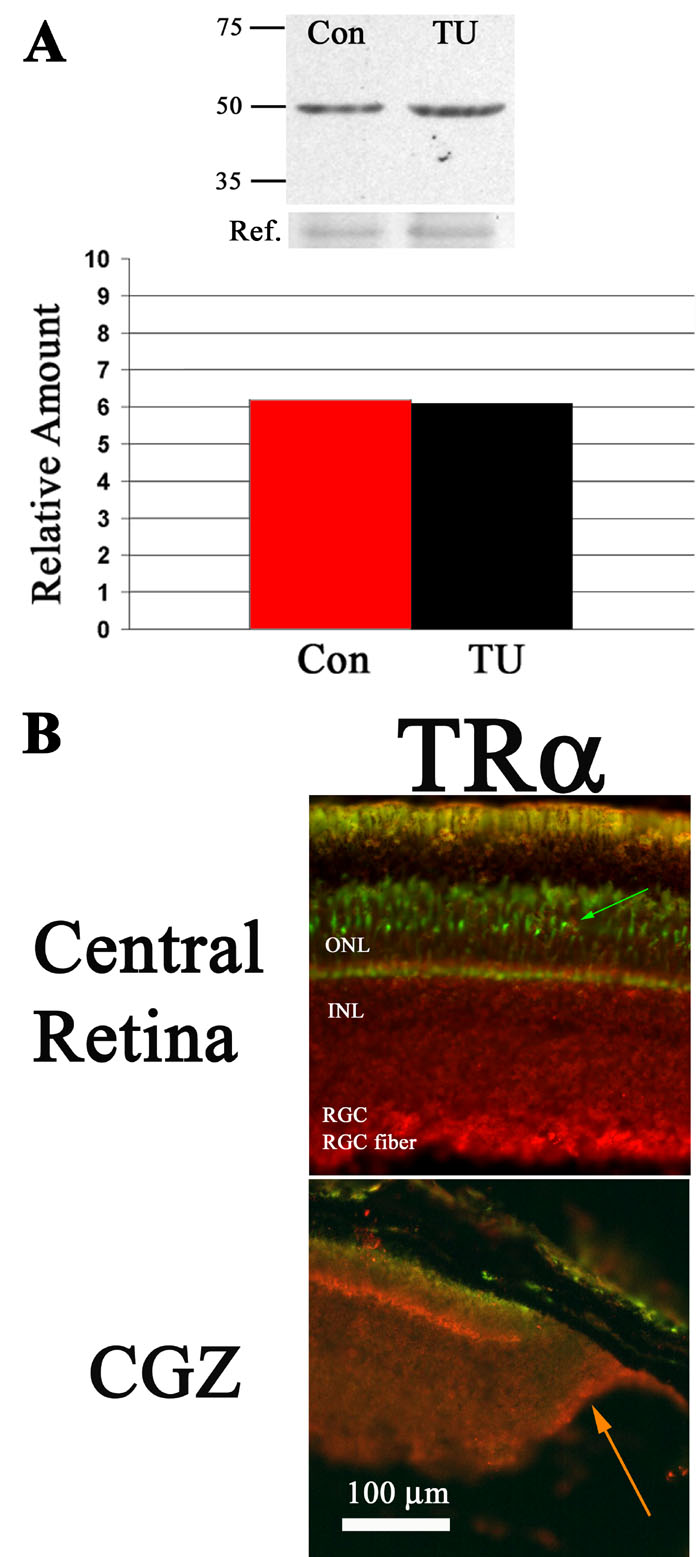
Figure 3. TRα protein in postmetamorphic flounder retina
A: Western blot analysis of TRα. Top, The anti-TRα recognizes a single band at approximately 48 kda, a size consistent with fish TRα protein [47], for material derived from either control or thiourea (TU)-exposed postmetamorphic retinas. Size markers are indicated, in kda, along with a loading control reference. Bottom, Quantification of the bands labeled with anti-TRα indicated no TU-dependent change in the retinal level of TRα protein, the signal amplitude of which was approximately 6 fold greater than the reference. B: Indirect immunohistochemical analysis of TRα protein in postmetamorphic retina. In each panel, the anti-TRα antibody was visualized with the Cy3 fluorophore (i.e., red label); the top section was also been labeled with an antibody that recognizes cone photoreceptors (zpr1, green label and arrow). TRα protein is evident throughout the retina, including the RGC fiber layer and the CGZ (orange arrow, bottom panel). Anti-TRα label near the outer plexiform layer is evident in both panels.