![]() Figure 6 of
Stenkamp, Mol Vis 2005;
11:833-845.
Figure 6 of
Stenkamp, Mol Vis 2005;
11:833-845.
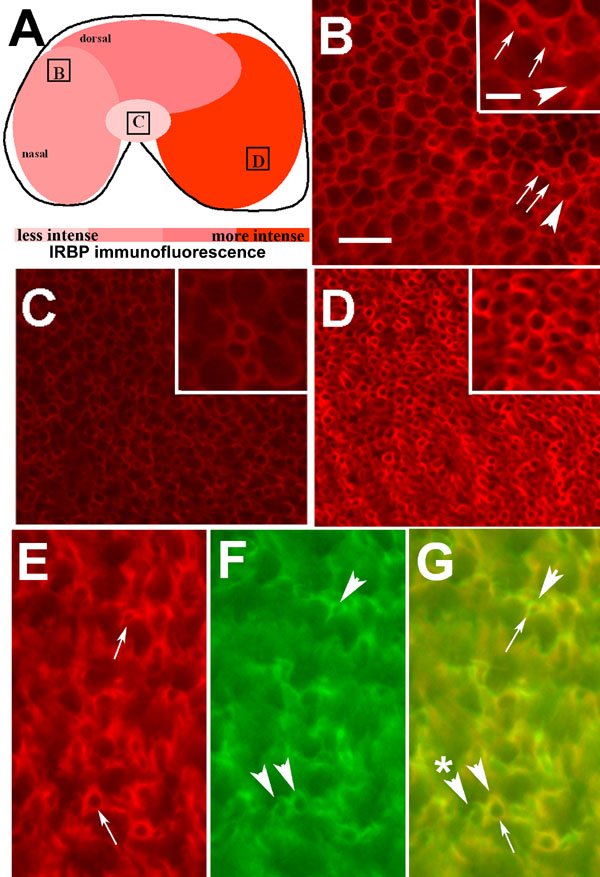
Figure 6. Topographic expression pattern of IRBP
A: Sketch of whole mounted retina showing regions scored for comparative intensity of IRBP immunofluorescence (using the monoclonal anti-bovine IRBP antibody). Three naïve observers scored several, 1 mm2 regions. Boxed areas indicate locations of three of these regions and correspond to panels B-D. In B-D, small profiles (arrows) and larger profiles (arrowheads) are specified at higher magification. E-G: Double labeling with anti-IRBP antibody (E) and peanut lectin (F), with merged image in G. IRBP-positive profiles, including smallest profiles (arrows) are also peanut-lectin-positive (arrowheads). Some peanut-lectin-positive profiles are not IRBP-positive (arrowhead with asterisk in G). Scale bar in B represents 10 μm and applies to B-D; scale bar in inset of B represents 5 μm and applies to all insets and E-G.