![]() Figure 4 of
Stenkamp, Mol Vis 2005;
11:833-845.
Figure 4 of
Stenkamp, Mol Vis 2005;
11:833-845.
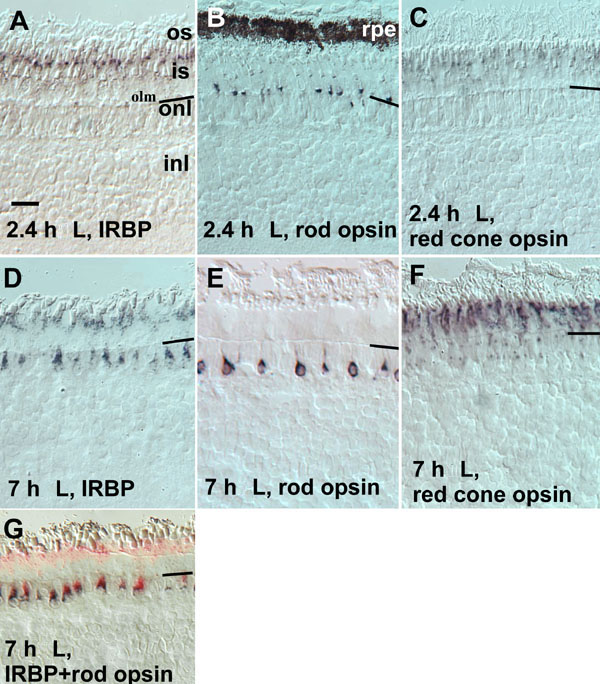
Figure 4. In situ hybridizations of IRBP and opsins on chicken retinal cryosections
A-C: Sections obtained from chickens sacrificed 2.4 h after light-onset (2.4 h L), hybridized with probes corresponding to IRBP (A), rod opsin (B), and red cone opsin (C). D-G: Sections obtained from chickens sacrificed 7 h after light-onset (7 h L), hybridized with probes corresponding to IRBP (D), rod opsin (E), red cone opsin (F), and a combination of IRBP and rod opsin (G). In G, IRBP expression is visualized with a red color product and rod opsin expression is visualized with a dark color product. The position of the outer limiting membrane (olm) in each image is indicated by thin black line; the outer segments (os), inner segments (is), outer nuclear layer (onl), and inner nuclear layer (inl) are also identified. The scale bar represents 10 μm.