![]() Figure 3 of
Stenkamp, Mol Vis 2005;
11:833-845.
Figure 3 of
Stenkamp, Mol Vis 2005;
11:833-845.
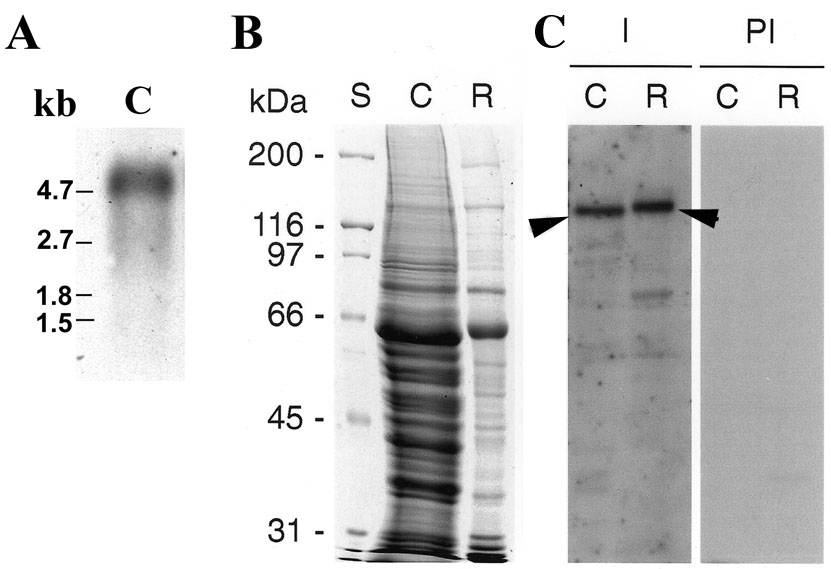
Figure 3. Northern and western blot analysis of chicken IRBP expression
A: Northern analysis of chicken (C) IRBP mRNA reveals a predominant single transcript of about 4.8 kb. B: The Coomassie blue stained SDS-PAGE of soluble interphotoreceptor matrix fractions obtained from chicken and rat retina. C: Western blot comparing chicken (C) and rat (R) IRBPs; autoradiograms of blots from identical unstained gels probed with rabbit anti-X4IRBP (the same "anti-Xenopus IRBP (fourth module)" as used in Figure 5) serum (I) or pre-immune serum (PI) followed by goat [125I]antirabbit IgG. Arrowheads point to chicken IRBP (140 kDa) and rat IRBP (144 kDa) bands. Lane "S" contains molecular weight standards.