![]() Figure 2 of
Stenkamp, Mol Vis 2005;
11:833-845.
Figure 2 of
Stenkamp, Mol Vis 2005;
11:833-845.
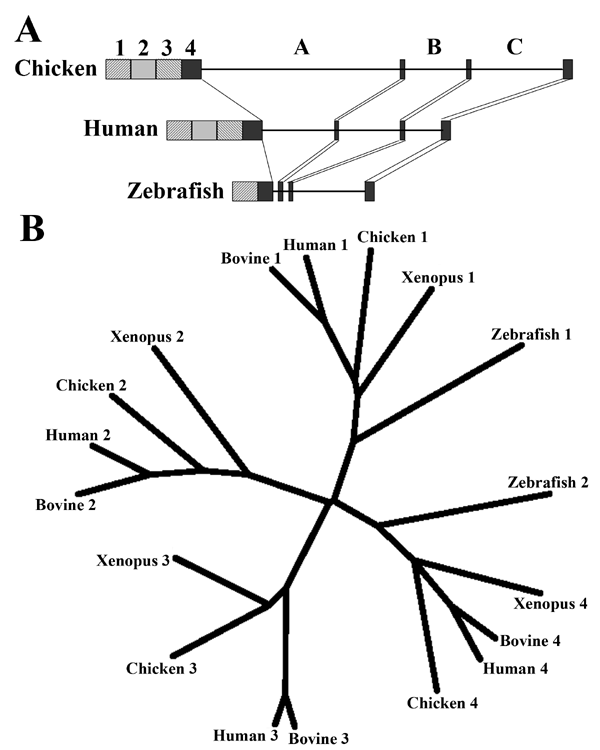
Figure 2. Genomic and phylogenetic analysis of chicken IRBP
A: Genomic structure of chicken IRBP compared to human [66] and zebrafish [11] IRBP; exons are represented by boxes and introns are represented by lines. B: Phylogenetic analysis of vertebrate IRBP modules. Unrooted, neighbor-joining tree was prepared in Biology Workbench using amino acid sequence alignments and default parameters for PHYLIP [53,79].
