![]() Figure 4 of
Cameron, Mol Vis 2005;
11:775-791.
Figure 4 of
Cameron, Mol Vis 2005;
11:775-791.
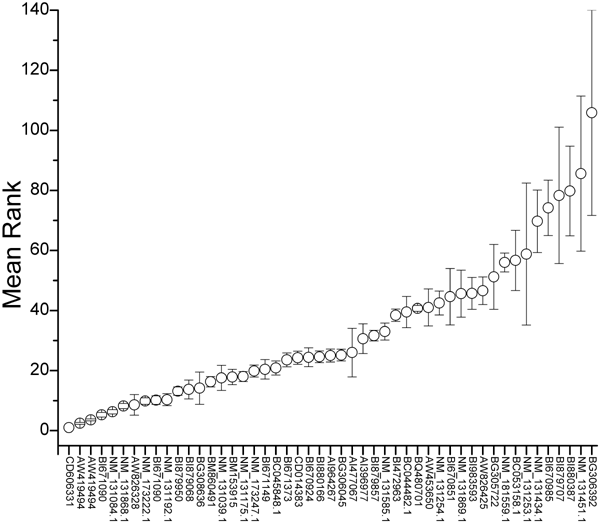
Figure 4. Reproducibility of the DNA microarray technique applied to zebrafish retina
The accession numbers of the fifty most-abundant transcripts in true control retina (Figure 1) are plotted with respect to their respective mean abundance rank across all other samples of control retina (n=4). Error bars represent the standard error of the mean.
