![]() Figure 3 of
Ponce, Mol Vis 2005;
11:752-757.
Figure 3 of
Ponce, Mol Vis 2005;
11:752-757.
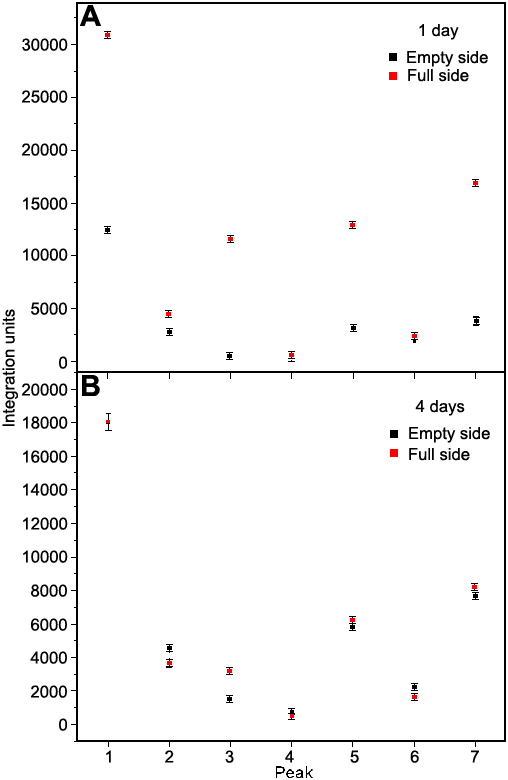
Figure 3. Area of each γ-crystallin peak from the empty and full chambers, after injection of total γ-crystallin into the full chamber
Each point is the mean of three determinations; the error bars represent the standard deviation. Units were obtained after integrating the peaks from Figure 2. A: One day incubation. B: Four day incubation.
