![]() Figure 2 of
Ponce, Mol Vis 2005;
11:752-757.
Figure 2 of
Ponce, Mol Vis 2005;
11:752-757.
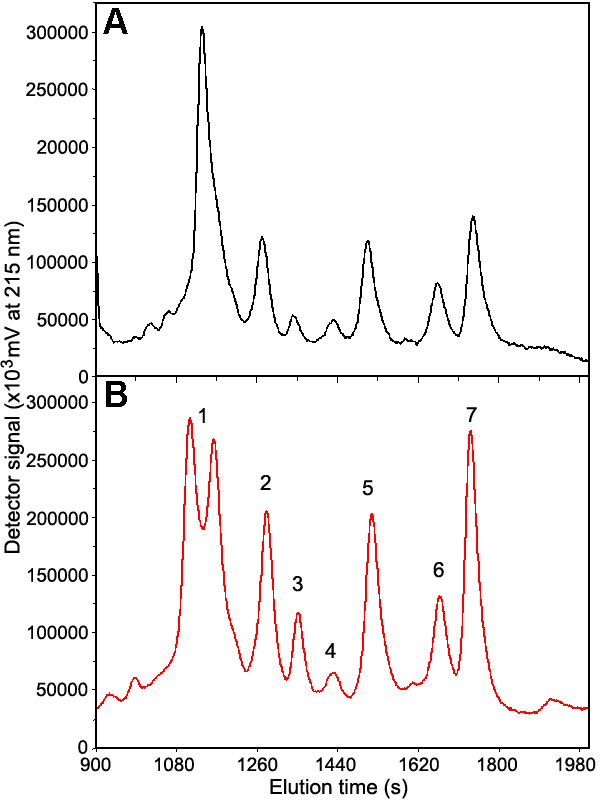
Figure 2. Elution profiles of γ-crystallin species in "empty" microequilibrium dialysis chambers
Representative C18, reverse phase profiles of total γ-crystallin in the "empty" chamber of the microequilibrium dialysis apparatus after injection of γ-crystallin into the "full" chamber. Each peak is designated by a separate number. Peak 1 separated into two peaks after four days incubation. A: Profile of γ-crystallin in empty chamber after incubation for 1 day. B: Profile of γ-crystallin in empty chamber after incubation for 4 days.
