![]() Figure 3 of
Fan, Mol Vis 2005;
11:76-87.
Figure 3 of
Fan, Mol Vis 2005;
11:76-87.
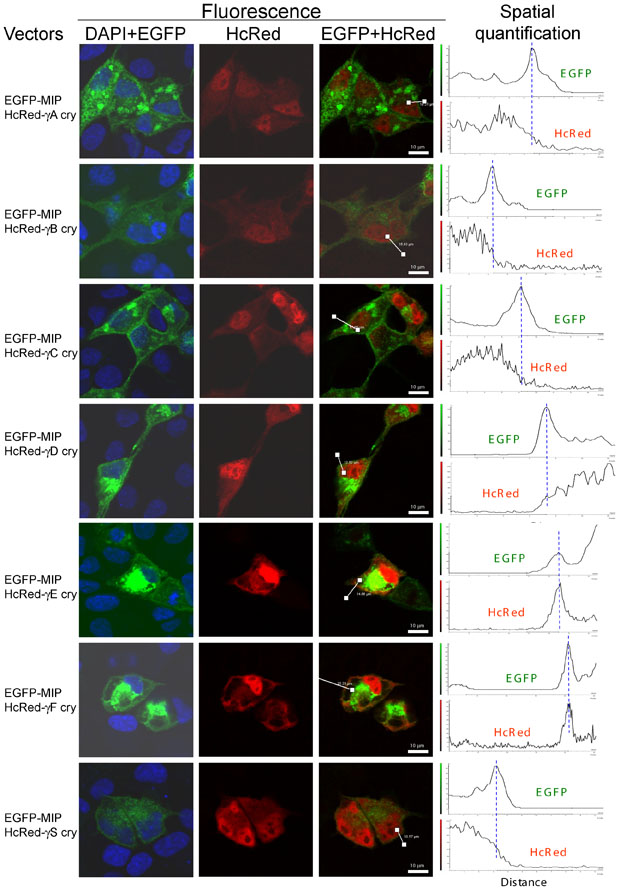
Figure 3. Interaction of MIP with γ-crystallins in mammalian cells
RK13 cells were co-transfected with EGFP tagged MIP expression plasmid and one of the following HcRed tagged γ-crystallin expression plasmids: pHcRed-γA cry (Figure 2C), pHcRed-γB cry (Figure 2D), pHcRed-γC cry (Figure 2E), pHcRed-γD cry (Figure 2F), pHcRed-γE cry (Figure 2G), pHcRed-γF cry (Figure 2H), or pHcRed-γS cry (Figure 2I). Forty-eight h after transfection, the cells were fixed with a buffer containing 4% paraformaldehyde and counterstained with the nucleus staining dye DAPI (1 μg/ml). The cells were then visualized by confocal fluorescence microscopy. Images or superimposed images from three channels of fluorescence (DAPI, EGFP, HcRed) were obtained (DAPI+EGFP, HcRed, EGFP+HcRed). Spatial quantification was performed along a path across the plasma membrane, indicated by a white line with prominent end points in the EGFP+HcRed images. EGFP fluorescence and HcRed fluorescence was quantified separately and plotted as a function of distance along the path. Blue lines in the spatial quantification graphs indicate the approximate location of the plasma membrane. The scale bars represents 10 μm. Photographs and spatial quantification graphs shown are representative of those obtained from at least six different fields.